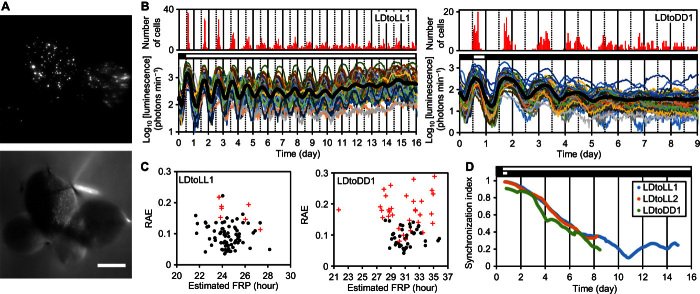
Fig. 1. Cellular rhythms were desynchronized after being released into constant conditions.
Plants grown under LL were subjected to particle bombardment and subsequently entrained in an LD cycle before starting bioluminescence monitoring. (A) Bioluminescence (top) and bright-field (bottom) images of a colony of L. gibba with four fronds. Scale bar, 2 mm. (B) Mean luminescence (black circles) and luminescence traces (other colored solid lines) of 85 cells in the frond (LDtoLL1, table S1) (left) and 73 cells in the frond (LDtoDD1, table S1) (right). The number of cells peaking at every hour is shown at the top. (C) FFT-NLLS analysis for cellular rhythms under LL (LDtoLL1, days 1 to 16) (left) or DD (LDtoDD1, days 1 to 9) (right). RAEs of rhythm-sustained cells (closed circles) and other cells that did not meet the criteria for circadian rhythms (red crosses) were plotted against estimated FRPs (see Materials and Methods). (D) Temporal changes in SIs during the three experiments. Open and black bars indicate light and dark conditions, respectively.

