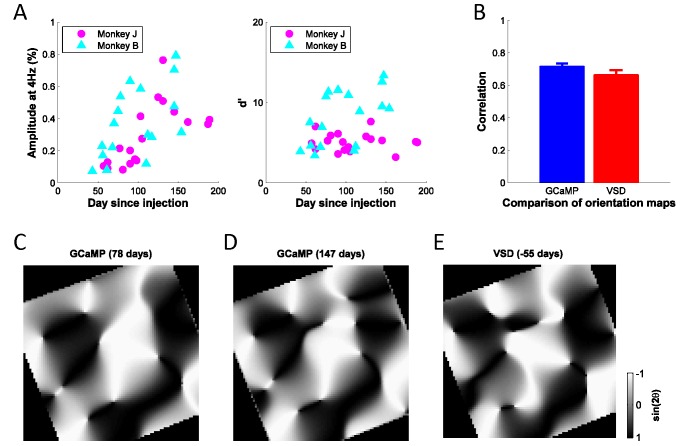
Figure 4. Stability of GCaMP signals over time and cortical map.
(A) Signal amplitudes and d’ (signal amplitude over signal standard deviation) to large flashed gratings over a period of ~200 days after viral injection for two monkeys. Fluctuations in signal amplitude and quality are mainly due to variations in the clarity of the aCSF fluid in the chamber. (B) Average correlation coefficients between any two GCaMP orientation maps (N = 8, blue bar), or between one GCaMP map (N = 8) and one VSD map (N = 2, red bar), where 'N' indicates separate experiments. Error bars ± SEM. Prior to computing correlations, maps were aligned based on the vasculature. (C), (D) Two examples of GCaMP orientation maps at the same site, but measured at different times after viral injection. The preferred orientation at each pixel is converted to the range of [−1, 1] by taking the sine of twice the preferred orientation. The correlation coefficient between the two gray-scale maps is 0.80. (E) One example of VSD orientation map at the same site as (C) and (D), but 55 days before viral injection. The correlation coefficients between the map in (E) and the maps in (C) and (D) are 0.71 and 0.78, respectively.

