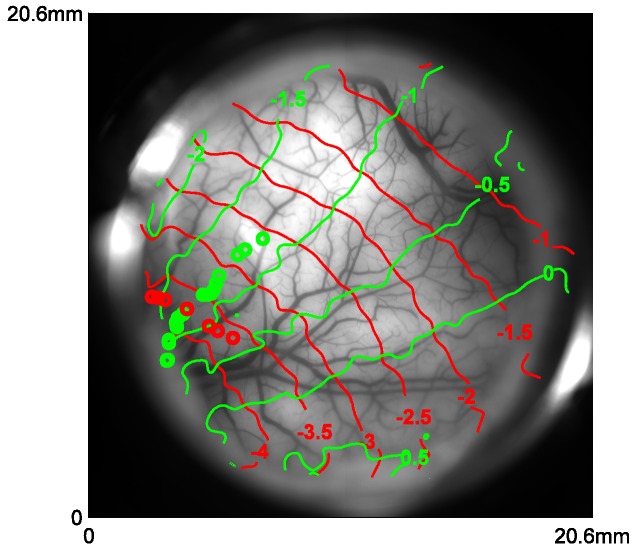
Figure 5. Retinotopic map obtained with VSD imaging and corresponding cortical locations of the centers of Gabor patches used in position tuning.
Red and green curves represent the coordinates of X and Y in visual field in one monkey, respectively. Red and green circles represent the corresponding locations of the Gabors in vertical and horizontal trajectories, respectively.

