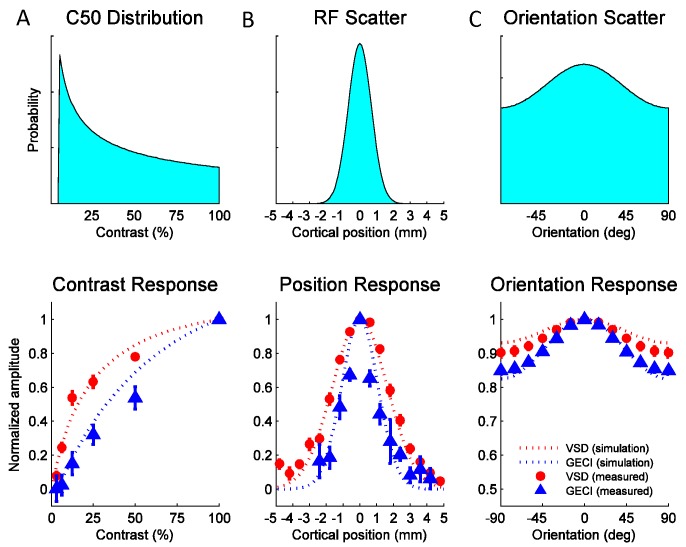
Figure 8. Widefield GCaMP signals in V1 of behaving macaques are consistent with the summed spiking activity.
Simulated and observed tuning curves for stimulus contrast (A), position (B) and orientation (C). The computational framework in Figure 7 was simulated with typical values for V1 receptive field (RF) parameters from the literature (see Table 1). Top panels show distributions of tuning properties while bottom panels show model predicted and observed tuning curves for GCaMP and VSD signals. Population pooling was made across neurons with different contrast semi-saturation (A), RF center position (B) and preferred orientation (C). In all stimulus dimensions (contrast, position and orientation), the simulation predicted GCaMP and VSD responses closely approximate the measured responses.

