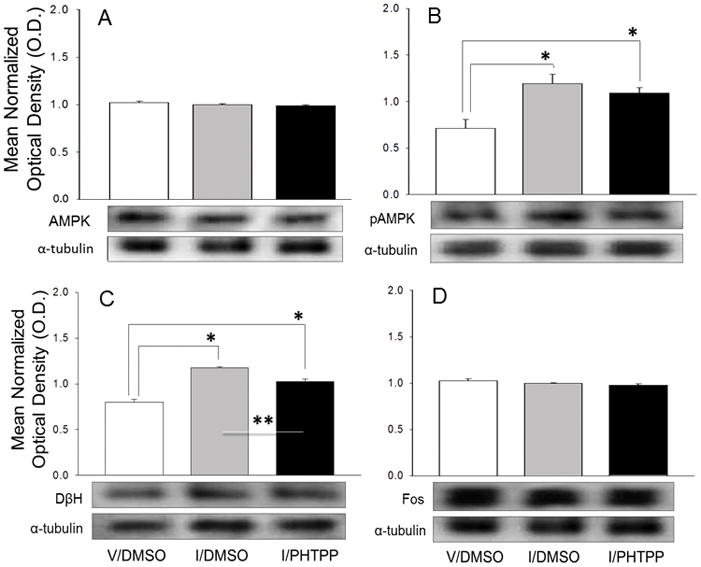
Figure 1. Effects of Hindbrain Estrogen Receptor-Beta (ERβ) Antagonism on A2 Noradrenergic Nerve Cell Adenosine 5′-Monophosphate-Activated Protein Kinase (AMPK), PhosphoAMPK (pAMPK), Dopamine-β-Hydroxylase (DβH), and Fos Proteins in Insulin-Injected Steroid-Primed Ovariectomized (OVX) Female Rats.

Individual tyrosine hydroxylase (TH)-immunoreactive (-ir) A2 neurons were harvested by laser-catapult microdissection from 10 μm-thick sections of the caudal dorsal vagal complex 2 hr after sc injection (14.00 hr; to) of vehicle (V; group 1; n=5) or neutral protamine Hagedorn Insulin (I; 12.5 U/kg bw; groups 2 and 3; n=5/group) of estradiol plus progesterone-primed OVX rats. Animals were pretreated at -20 min (13.40 hr) by caudal fourth ventricular (CV4) infusion of 200 nL of vehicle, dimethyl sulfoxide (DMSO; 200 nL; groups 1 and 2) or DMSO containing 10 uM 4-[2-Phenyl-5,7-bis(trifluoromethyl)pyrazolo[1,5-a]pyrimidin-3-yl]phenol (PHTPP; group 3). For each protein of interest, a minimum of four separate A2 nerve cell lysate pools were established for each treatment group (n=50 neurons per pool; n=10 cells per rat) for Western blot analysis. Protein band optical densities (O.D.) were quantified with Syngene Genetool 4.01 software and expressed relative to α-tubulin. Panels depict mean normalized O.D. values ± S.E.M. for A2 neuron AMPK (Figure 1.A), pAMPK (Figure 1.B), DβH (Figure 1.C), and Fos (Figure 1.D) proteins for the following treatment groups: V/DMSO (white bars), I/DMSO (gray bars), and I/PHTPP (black bars). Each panel also contains a representative immunoblot of the protein of interest and α-tubulin. *p < 0.05, versus V/DMSO; **p < 0.05, I/PHTPP versus I/DMSO.
