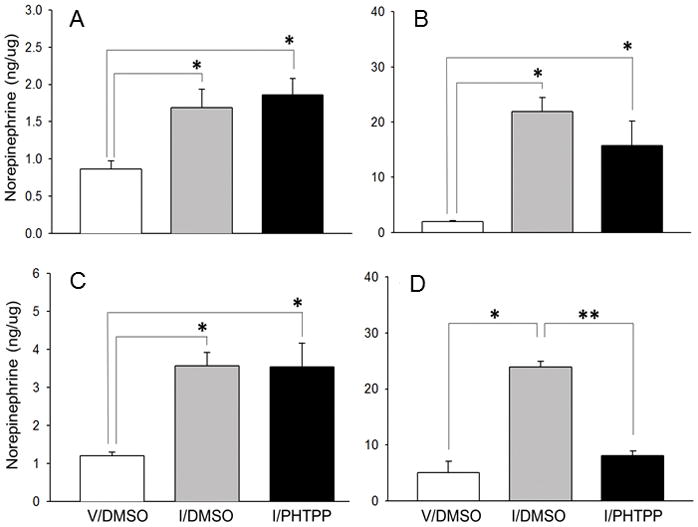
Figure 3. Site-Specific Effects of PHTPP on Norepinephrine (NE) Content in Insulin-Injected Steroid-Primed OVX Female Rats.

NE ELISA analysis was carried out on rostral preoptic area (rPO; Figure 3.A), anteroventral periventricular nucleus (AVPV; Figure 3.B), medial preoptic nucleus (MPN; Figur3.C), and hypothalamic arcuate nucleus (ARH; Figure 3.D) tissue samples obtained by bilateral micropunch dissection. For each structure, sample aliquots were combined from subjects to create three individual pools per treatment group for analysis. Bars depict mean NE content ± S.E.M. for V/DMSO (white bars), I/DMSO (gray bars), and I/PHTPP (black bars) groups. *p <0.05, versus V/DMSO; **p < 0.05, I/PHTPP versus I/DMSO.
