
Figure 1. Effects of therapeutic interventions on OxPL-apoB and Lp(a) levels.
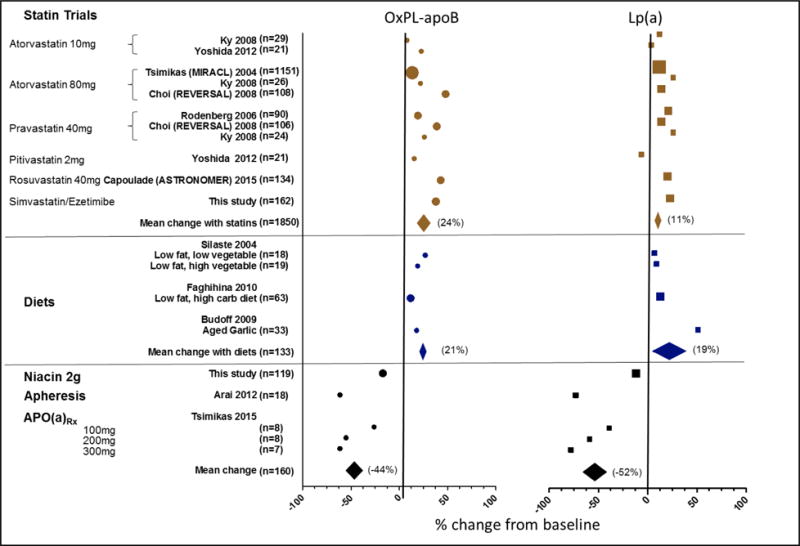
Systematic review of trials with OxPL-apoB and Lp(a) levels following intervention with statins (brown), beneficial diets (blue), and Lp(a) lowering therapies (black). Each filled symbol represents the mean percent change, or the delta mean percent change between the intervention and placebo group where available, from each respective trial. Diamond symbols represent the mean change within each respective interventional category and span the 95% confidence interval. Data from trials with larger of subjects are represented with larger symbol. Reprinted with permission from J Clinical Lipidology [28].