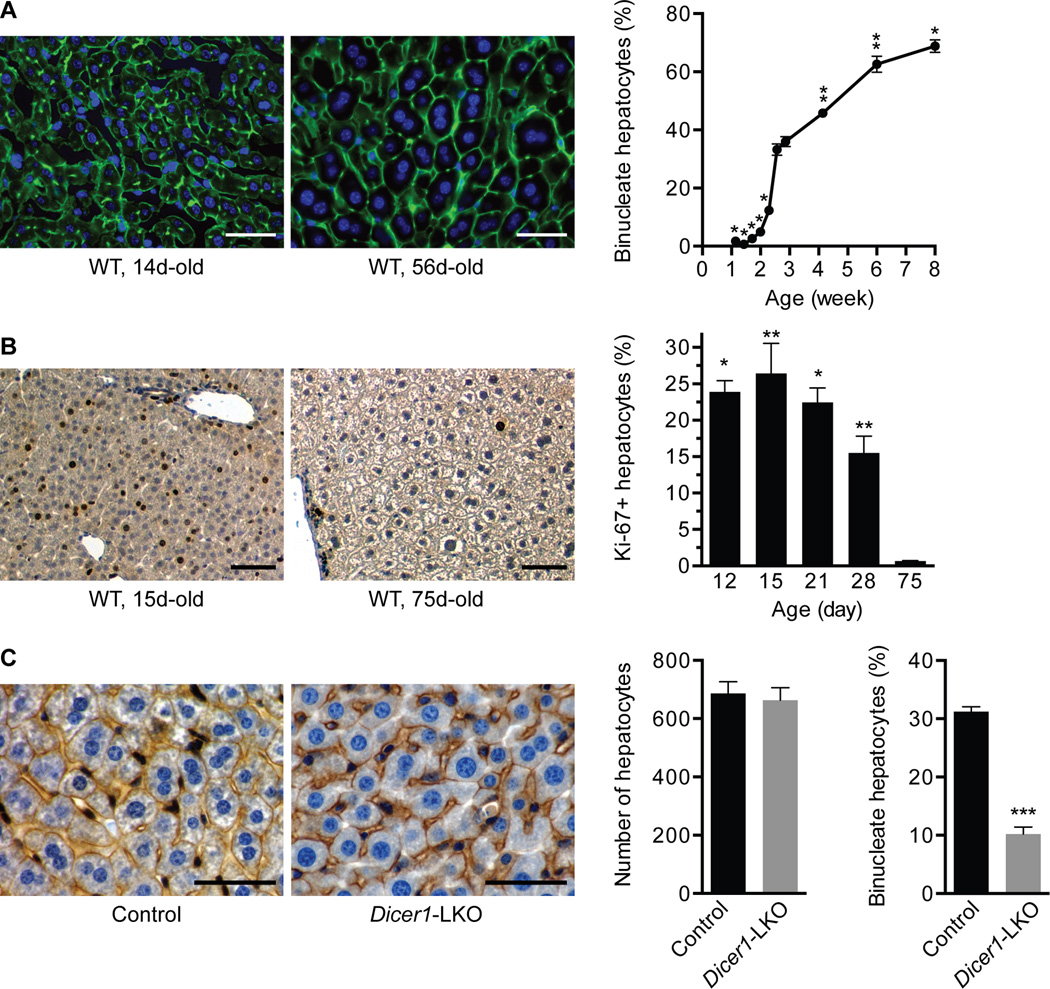
Fig. 1. Hepatic binucleation begins at 14d and is impaired in Dicer1-deleted livers.
(A) Livers from WT C57BL/6 mice ages 8–56d (n = 3) were stained with phalloidin (green) to mark cell boundaries and Hoechst 33342 (blue) to mark nuclei and the number of mono- and binucleate hepatocytes counted. Representative images show a 14d-old liver with small hepatocytes that are predominantly mononucleate and a 56d-old liver with large hepatocytes that are mono- or binucleate (left). The percentage of binucleate hepatocytes at each age is indicated (right). * P ≤ 0.003, ** P ≤ 0.02, compared to 18 and 20d. (B) Livers from WT C57BL/6 mice ages 12–75d (n = 3) were stained with the proliferation marker Ki-67 (brown) and hematoxylin (blue) for nuclei. Representative images show Ki-67+ hepatocytes in 15 and 75d-old livers (left). The percentage of Ki-67+ hepatocytes is indicated (right). P values at 12–28d are compared to 75d. (C) Livers from control or Dicer1-LKO mice ages 22–28d (n = 5) were stained for β-catenin (brown) to mark cell membranes and hematoxylin (blue) for nuclei. Representative images are shown (left). Control and Dicer1-LKO livers had equivalent numbers of cells per 200× field-of-view (middle), and binucleate hepatocytes were reduced 3-fold in Dicer1-LKO livers (right). *** P ≤ 0.0001. Graphs show mean ± SEM. Scale bars are 50 µm.

