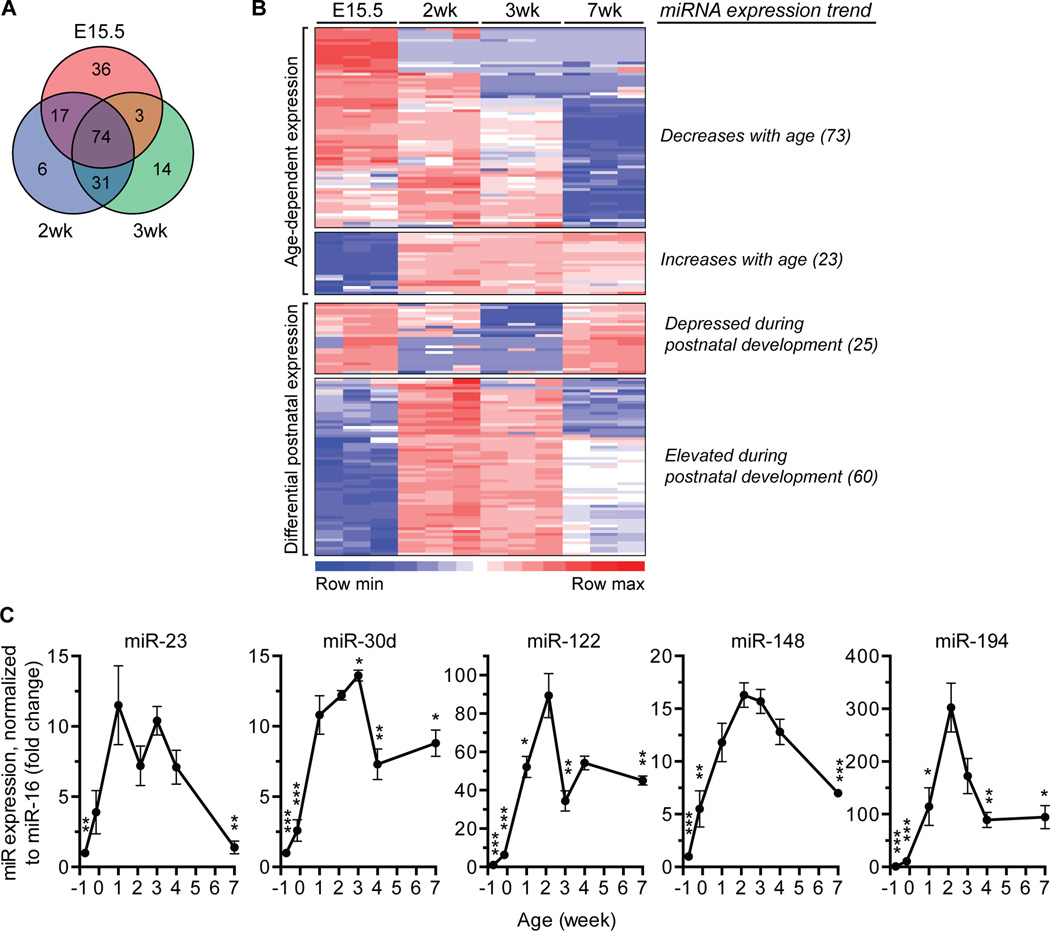
Fig. 2. miRNAs are temporally expressed in the mouse liver.
(A,B) miRNA expression was assessed in livers from WT C57BL/6 mice at ages embryonic day 15.5 (E15.5), 2-, 3- and 7wk (n = 3) using the nCounter Mouse miRNA Expression Assay from NanoString Technologies. Among the ~600 miRNAs examined, 181 were differentially expressed at E15.5, 2- and 3wk compared to 7wk-old livers (P < 0.05), as indicated in the Venn diagram (A). The heat map illustrates 4 major expression patterns (B). The number of miRNAs in each category is indicated in parentheses. Detailed expression profiles are in Supporting Table 1. (C) Expression of select miRNAs (elevated during postnatal development) was tracked in WT C57BL/6 livers at ages E15.5, E19.5, 1-, 2-, 3-, 4- and 7wk (n = 3–4) by quantitative reverse transcriptase PCR (qRT-PCR). Peak expression of miR-23, -30d, -122, -148 and -194 occurred at 1–3wks. Expression values were normalized to miR-16. * P < 0.04, ** P ≤ 0.009, *** P < 0.0008, compared to 2wk. Graphs show mean ± SEM.

