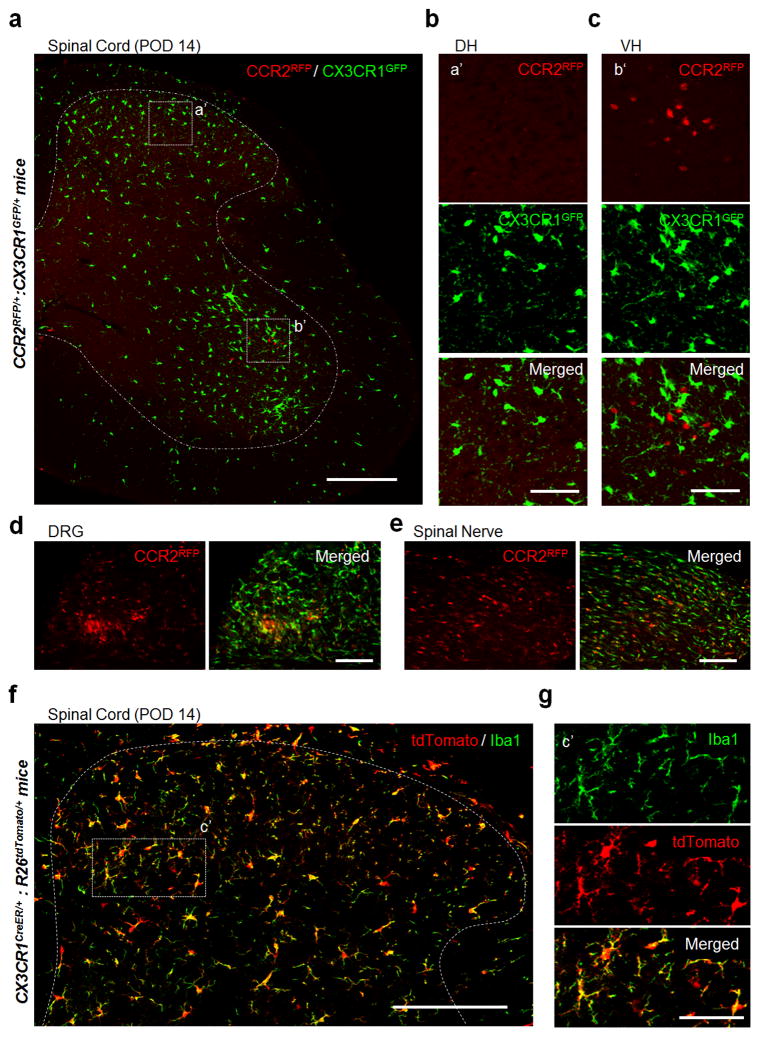
Figure 1. No monocyte infiltration into the dorsal horn of spinal cord after spinal nerve transection.
(a–c) Representative confocal images of the ipsilateral spinal cord at post-operative day (POD) 14 following spinal nerve transection (SNT) in double transgenic CCR2RFP/+:CX3CR1GFP/+ mice (a). Resident GFP+ microglia (CX3CR1GFP/+) are shown in green and infiltrated RFP+ monocytes (CCR2RFP/+) are shown in red. Dotted boxes show regions of higher magnification in the dorsal horn (DH, b) and ventral horn (VH, c), respectively. Note the obvious appearance of CCR2RFP/+ cells in the ipsilateral VH (c), but not DH (b). Scale bar is 200 μm (a) and 50 μm (b, c), respectively. Representative images of CCR2RFP cell infiltration in DH and VH before SNT and at POD7 after SNT are shown in Figures S1a–c and S1f–h. (d–e) CCR2RFP cell infiltration was found in L4 dorsal root ganglia (DRG, d) and the damaged spinal nerve stump (e) at POD 14 following SNT in CCR2RFP/+:CX3CR1GFP/+ mice. Scale bar is 100 μm. Representative images of CCR2RFP cell infiltration into DRG before SNT and at POD7 after SNT are shown in Figure S1d–e. (f–g) Representative images of the spinal cord DH at POD 14 following SNT in CX3CR1creER/+: R26tdTomato/+ reporter mice (f). The dotted box indicates the region that is magnified in g. Resident microglia are tdTomato+Iba1+ cells and hematogenous monocytes are tdTomato−Iba1+ cells. There are no tdTomato−Iba1+ cells in the DH. Scale bar is 150 μm (f) and 50 μm (g), respectively. (n=4 mice per group) Representative images before SNT and at POD3, POD7 following SNT using CX3CR1creER/+: R26tdTomato/+ reporter mice are shown in Figure S3.

