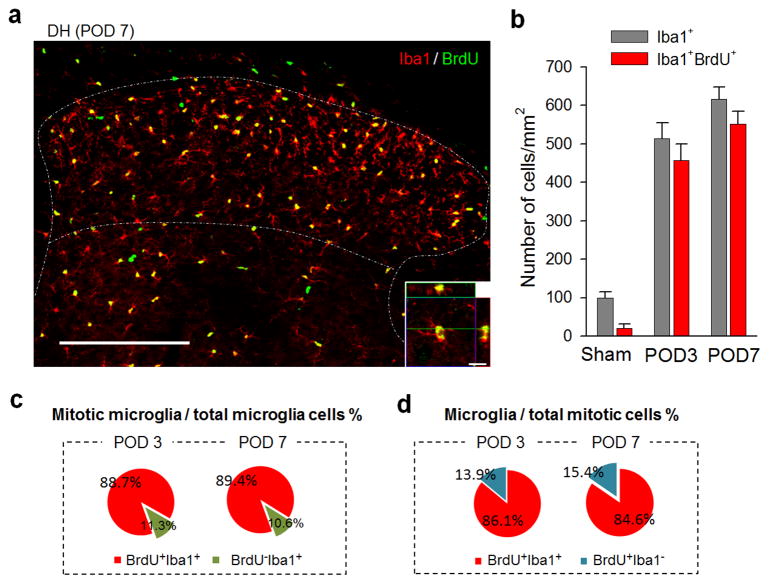
Figure 3. Local microglial proliferation dominates spinal microgliosis after spinal nerve transection.
(a) Representative confocal images of spinal cord DH showing co-localization of BrdU (green) and Iba1 (red) at POD 7 following SNT. BrdU (i.p. 100mg/kg) was applied immediately after SNT at 2 pulses/day for 7 days (n=4–6 mice per time point). Inset is z-sectioned image with high magnification, showing that BrdU+ signal are located in the nuclei of Iba1+ microglia. Scale bar is 200 μm and 10 μm for lower and higher magnification images, respectively. Representative images of the co-localization at POD3 after SNT are shown in Figure S4a. (b) Quantitative summary of the number of BrdU+ Iba1+ microglia in the ipsilateral DH (lamina I–IV) at POD3 and 7 was dramatically increased after SNT (see also Figure S4a–b for comparison of BrdU+ cells between contralateral and ipsilateral DH). Data are presented as mean ± s.e.m. Shown is summarized data for the number of Iba1+ and Iba1+BrdU+ cell per mm2 in DH in sham control and at POD3 and 7 after surgery (n = 4–6 mice per time point). (c–d) Microglial proliferation accounted for a majority of proliferating events after SNT. Shown is the percentage of BrdU+ Iba1+ cells among total Iba1+ cells, i.e mitotic microglial cells in total microglia (c), or the percentage of BrdU+ Iba1+ cells in BrdU+ cells, i.e. microglia in total mitotic cells (d) at POD 3 and 7 after SNT (n = 4 mice at POD3 and 6 mice at POD7).

