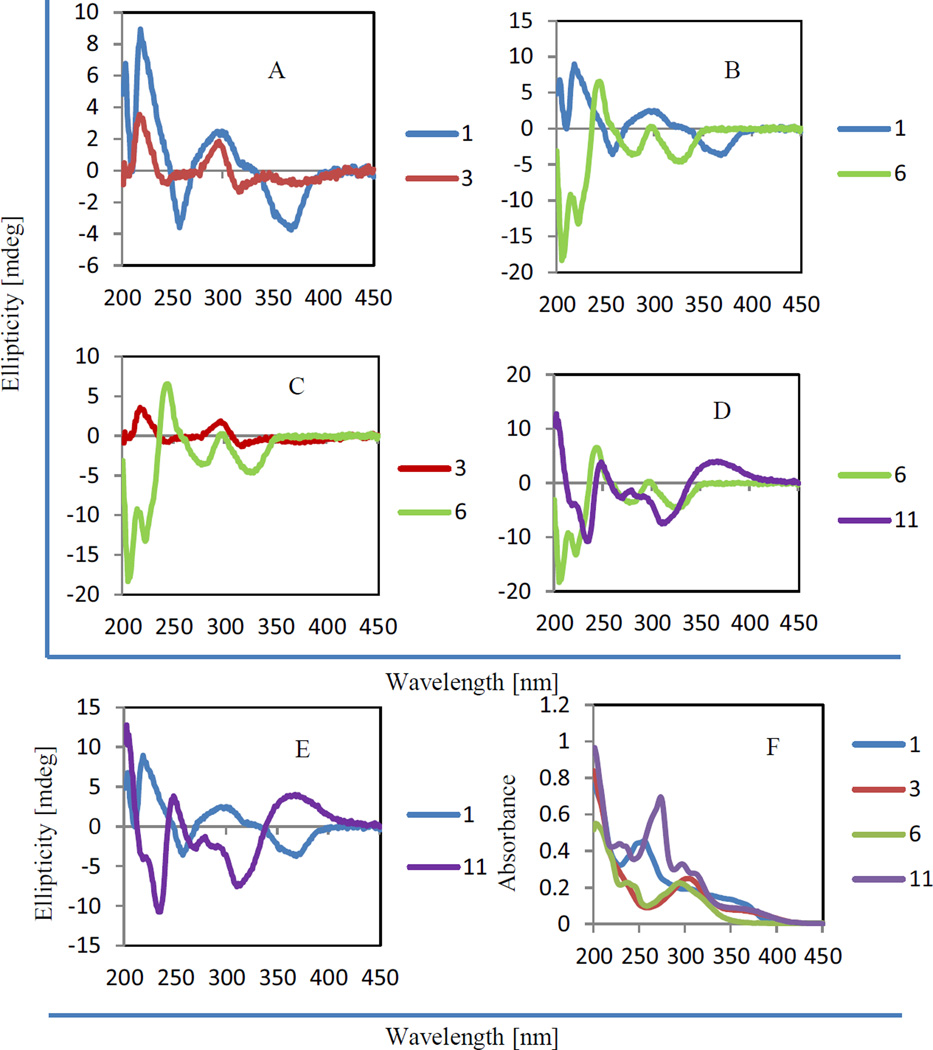
Fig. 2.
ECD (A–E) and UV (F) spectra of compounds 1, 3, 6, and 11. The ECD spectra were measured between 450 and 200 nm at room temperature using MeOH solution in a cell of 0.5 cm pathlength, with scanning speed of 50 nm/min and three accumulations, and corrected by subtracting a spectrum of the appropriate solution in the absence of the samples recorded under identical conditions. The UV spectra were recorded in MeOH in a range 200–450 nm with MeOH used as the reference.

