
Figure 3. Relative proteoform abundances between clinical acute rejection (cAR) and transplant excellent (TX) patients.
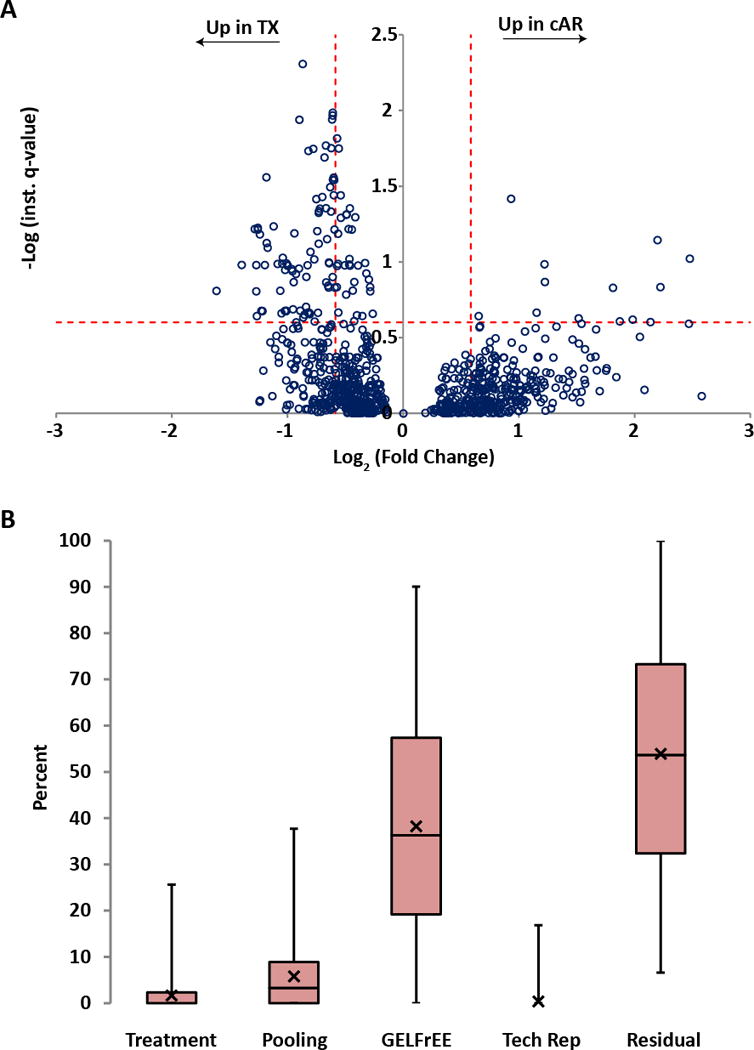
(A) To each proteoform identified in the dataset (open circle), a linear hierarchical model was applied to assign sources of variation in signal intensity from across the experiment. The y-axis (instantaneous q-value) is a measure of statistical confidence that the variation in signal intensity of a given proteoform is due to the treatment effect (TX vs. cAR) rather than due to patient variability, GELFrEE fractionation, technical variability, or noise. The x-axis is the fold change in proteoform abundance between patient groups. The horizontal dotted line represents a quantitative false discovery rate of 25%, that is, at this instantaneous q-value, signal intensity differences are 75% likely to be due to the treatment effect. The vertical dotted lines represent effect sizes of 1.5-fold above and below a no-change value. (B) For each proteoform quantified, variation in signal intensity was assigned, as a percent of the total for that proteoform, to either Treatment (TX vs. cAR), Pooling (biological replicates, which were pooled patient samples), GELFrEE (fractionation), Tech Rep (replicate LC-MS injections), or Residual (variation not explained by any of the aforementioned sources). The data are displayed as box-and-whisker plots, where the first quartile extends from the bottom line to the bottom of the box; the second quartile extends from the bottom of the box to the median, which is represented as a horizontal line within the box; the third quartile extends from the median to the top of the box; the fourth quartile extends from the top of the box to the top of the line. The average for each category is represented as an X. To illustrate, if there were only one proteoform quantified, the chart would have one data point in each category with the percentages across all categories summing to one hundred.