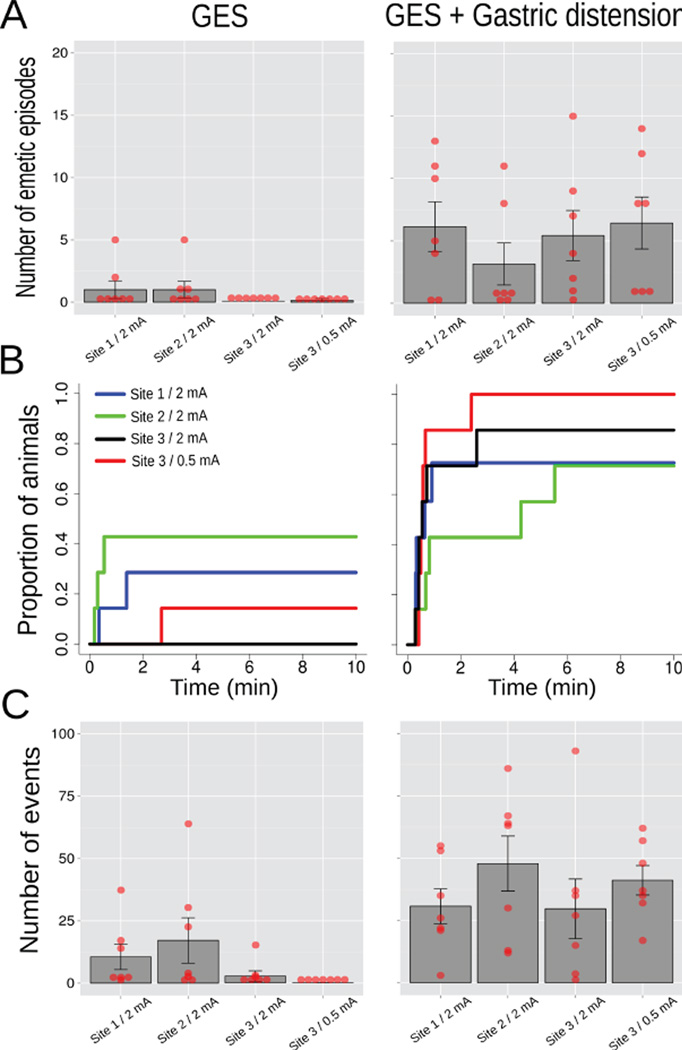
Figure 6.
Study 4, the effects of GES site (sites 1, 2, and 3, Fig. 1; 10 min) and current (2 or 0.5 mA) on emesis and esophageal contractions alone or combined with gastric distension (10 min of 4 ml of balloon inflation; n=7/group)(A) Number of emetic episodes. (B) Cumulative proportion of animals showing Lthe latency to the first emetic episode. (C) Number of esophageal contractions. Red dots = scatter plot of raw data; bars = mean ± SEM.

