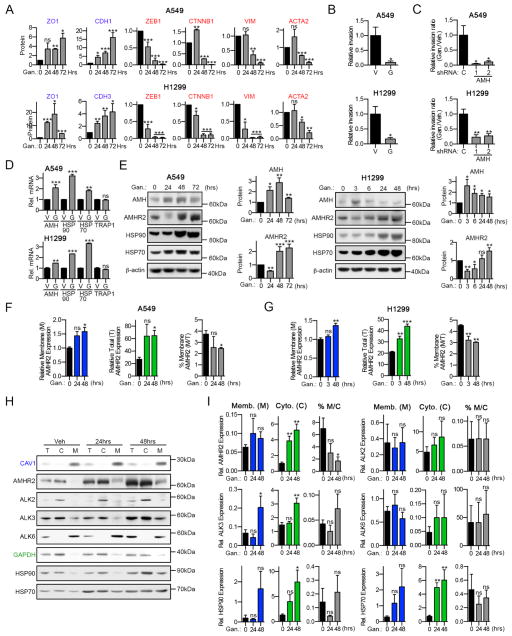
Figure 6. HSP90 inhibition induces MET and increases AMH/AMHR2 expression.
(A) Quantification (normalized to β-actin loading controls) of Western analysis of indicated proteins for A549 and H1299 cells 0–72 hours after treatment with 100 nM of ganetespib. (B, C) Quantification of relative cell invasion through Matrigel for A549 cells and H1299 treated with vehicle or 100 nM of ganetespib, +/− depletion of AMH; see also Figure S6. (D) Relative mRNA expression (normalized to the POLR2F housekeeping gene) for AMH, HSP90, HSP70 and a TRAP1 unaffected control after 24 hours of treatment with vehicle (V) or 100 nM ganetespib (G). (E) Representative Western blots and quantification for AMH and AMHR2 expression in A549 and H1299 cells treated with 100 nM ganetespib for 0–72 hours. Increased HSP70 expression indicates response to HSP90 inhibition. (F, G) FACS of non-permeabilized (blue; membranous (M)) or permeabilized (green; total (T)) cells using AMHR2-specific antibodies after treatment with 150 nM ganetespib. Averaged median fluorescence intensity (MFI) values from multiple independent experiments for each condition normalized to membranous AMHR2 for control (Gan. 0) are shown. (H) Representative images of Western blots following treatment with 150 nM ganetespib; different cellular components are shown: total (T), cytosolic (C), and plasma membrane (M) fractions. (I) Quantifications for (H): protein expression for (M) was normalized to a CAV1 loading control, and for (C) to GAPDH and total (T) protein expression for vehicle treated cells; normalized results for M and C were used to calculate % plasma membrane localization (M/C × 100; gray). *, p<0.05; **, p<0.01; ***, p<0.001. Data are presented as mean ± SEM; Student’s t-test was used to assess significance.

