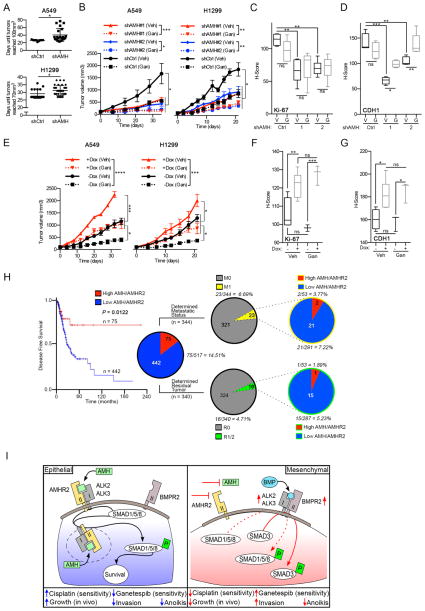
Figure 7. AMH depletion reduces tumor growth and sensitizes tumors to HSP90 inhibition.
(A) Days required for tumors to reach 70–100 mm3 after inoculation with 1 × 10⁷ shAMH- or control-depleted (shCtrl) A549 or H1299 cells. (B) Relative tumor volume for A549 or H1299 xenografts with or without stable AMH depletion, receiving weekly dosing with ganetespib (100 mg/kg) or vehicle. (C, D) Quantified Ki-67 and CDH1 staining for all tumors. See Figure S7 for representative images. (E) Relative tumor volume for A549 or H1299 xenografts with or without Dox activated overexpression of AMH, receiving weekly dosing with ganetespib (100 mg/kg) or vehicle. (F, G) Quantified Ki-67 and CDH1 staining for all tumors. See Figure S7 for representative images. (H) Disease free survival of patients with lung adenocarcinoma expressing (TCGA RNA-seq. data) either high or low levels of AMH and/or AMHR2 (high AMH/AMHR2 (red) = z-score of >0.9). Left pie chart: samples with high (z-score of >0.9; red) or low (blue) expression of AMH, AMHR2 or both. Right pie charts: data for metastatic status (top chart) and post-surgery residual tumor (bottom chart); the percentages of cases with high (red) or low (blue) AMH/AMHR2 expression for each of the two clinical determinants are shown. M0 = no distant metastasis detected; M1 = metastasis to distant organs detected; R0 = negative margins (microscopically); R1/2 = positive margins (microscopically/gross examination). (I) Proposed model. *, p<0.05; **, p<0.01; ***, p<0.001. Data are presented as mean ± SEM; Student’s t-test was used to assess significance.

