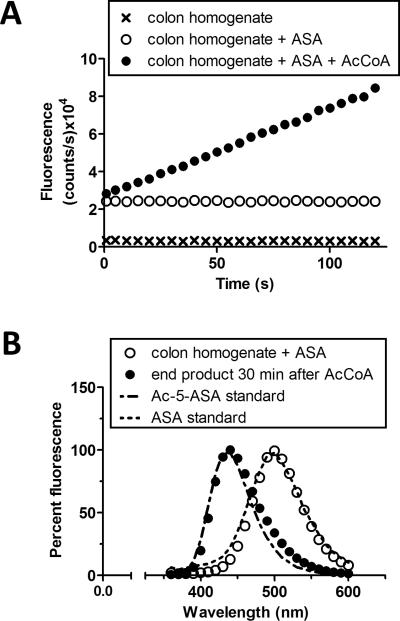
FIGURE 3.
Measurement of human NAT activity. (A) Representative traces of NAT enzyme activity at 312 nm excitation and 437 nm emission. Fluorescence of colon homogenate (x) was recorded over 120 seconds, then 5-ASA (ASA) was added sequentially to the same homogenate (o), then thirdly, AcCoA was added to start the reaction (●). After 5-ASA or AcCoA addition, representative traces were reset to time zero for comparison. (B) Colon homogenate with 5-ASA (○) compared to the spectra of 5-ASA standard (dotted line). Same colon homogenate plus 5-ASA 30 minutes after addition of AcCoA (●), to initiate the reaction, compared to the spectra of Ac-5-ASA standard (dot-dash-dot line).

