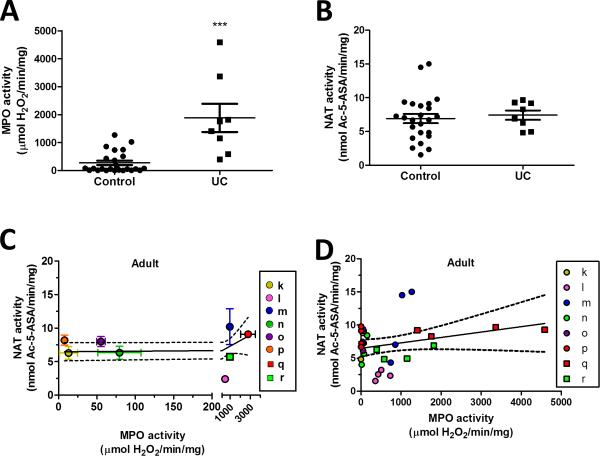
FIGURE 5.
Effect of inflammation on 5-ASA metabolism in adult rectosigmoid biopsies. (A) MPO enzyme activity (B) and NAT enzyme activity was measured in rectosigmoid biopsies of de-identified adult control and ulcerative colitis (UC) patients. Values are mean ± SEM. ***P < 0.0001, vs. corresponding control. NAT activity between control and UC biopsies are not significant. Adult control patients are assigned the letters #k, through p, solid colored circles; ulcerative colitis patients are #q and r, solid colored squares. Graphs (C and D) show the correlation of NAT enzyme to MPO enzyme activity and are analyzed by linear regression with 95 % confidence levels (dotted line). (C) Each point represents one patient. Values are mean ± SEM for MPO and NAT activity. The region between 0 and 200 μmol H2O2/min/mg MPO activity is expanded to better show the SEM for each patient. (D) Each point represents one biopsy and each color (solid colored symbol) represents one patient.

