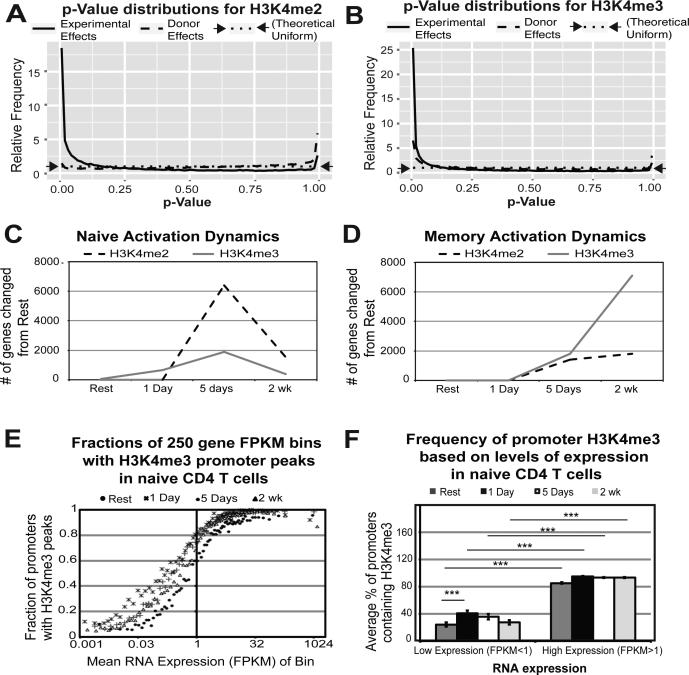
Figure 1. Differential promoter H3K4me2 and H3K4me3 is dependent on condition (i.e. time point and subset) and is dynamic throughout CD4 T cell activation.
For H3K4me2 A) and H3K4me3 B), the distribution of p-values for two different tests is plotted: an ANOVA test for differences between all combinations of experimental factors (cell type and time point) while treating the donor as a batch effect (solid line), and an ANOVA between donors while treating experimental factors as batch effects (dashed line). A uniform distribution (indicated by the dotted line) would indicate no evidence of differential enrichment by donor, while the strength of the spike near p=0 indicates significant differential enrichment by the experimental design. H3K4me enrichment is dynamic throughout activation for both naïve C) and memory D) subsets. E) Promoter H3K4me3 peaks correlate with high RNA expression throughout activation. Bins of 250 genes were plotted for mean RNA expression and % of promoters containing H3K4me3 peaks at all time points examined. F) Highly expressed genes have significantly more promoters with H3K4me3 peaks. Genes were divided into low (FPKM<1) and high (FPKM>1) expression and plotted against their average promoter H3K4me3 peak percentage for all time points examined (resting, 1 day, 5 days, and 2 weeks) in naïve CD4 T cells. Error bars represent variance from one-way ANOVA. Reported p-values are from Tukey's HSD post-hoc analysis (***p<0.0001).

