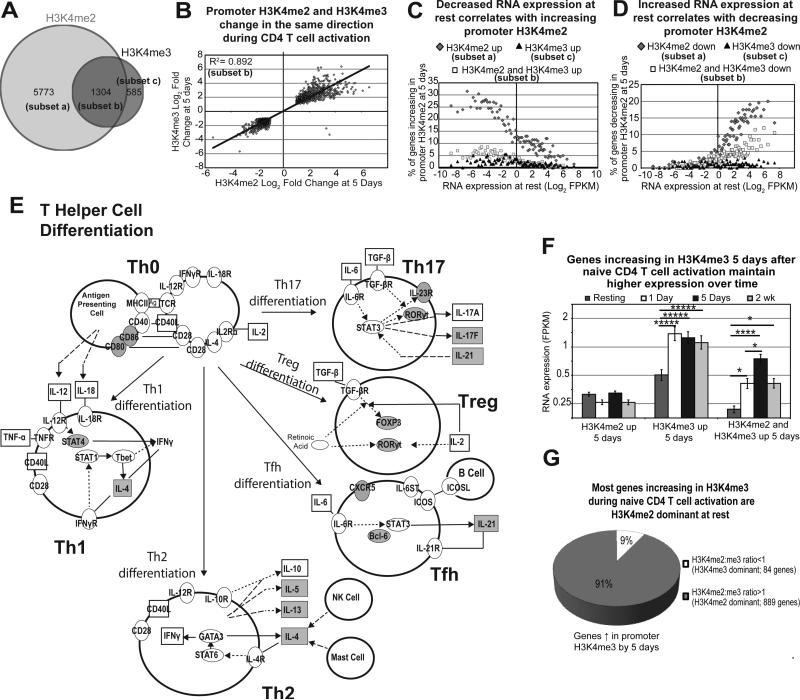
Figure 4. Promoter H3K4me2 and H3K4me3 act in tandem to regulate RNA expression during naïve CD4 T cell activation and promote Th differentiation.
A) Venn diagram of promoters changing in H3K4me2 and H3K4me3 enrichment 5 days after activation of naïve CD4 T cells. B) Promoters changing in both H3K4me2 and H3K4me3 enrichment 5 days after activation are changing in the same direction. Pearson's correlation is pictured. C) Bins of 200 genes were plotted for RNA expression at rest (x-axis), and the percentage of genes increasing in H3K4me2 alone (dark grey diamonds), H3K4me3 alone (black triangles), or both (white squares) at 5 days (y-axis). D) Bins of 200 genes were plotted for RNA expression at rest and the percentage of genes decreasing in H3K4me2 alone (dark grey diamonds), H3K4me3 alone (black triangles), or both (white squares) at 5 days. E) Th cell differentiation is one of the top pathways influenced by increased promoter H3K4me2 in naïve CD4 T cells during activation. Shaded molecules represent gene promoters that significantly increase H3K4me2 enrichment 5 days after activation of naïve CD4 T cells. F) RNA expression for all time points examined was plotted for genes increasing in promoter H3K4me2 alone, H3K4me3 alone, and both H3K4me2 and H3K4me3 at 5 days. Error bars represent standard error of the mean. ****p<1×10⁻⁵, *p<0.01 from Fisher's LSD post-hoc analysis following one-way ANOVA. G) 91% of genes increasing in H3K4me3 during activation were H3K4me2 dominant at rest in naïve cells.

