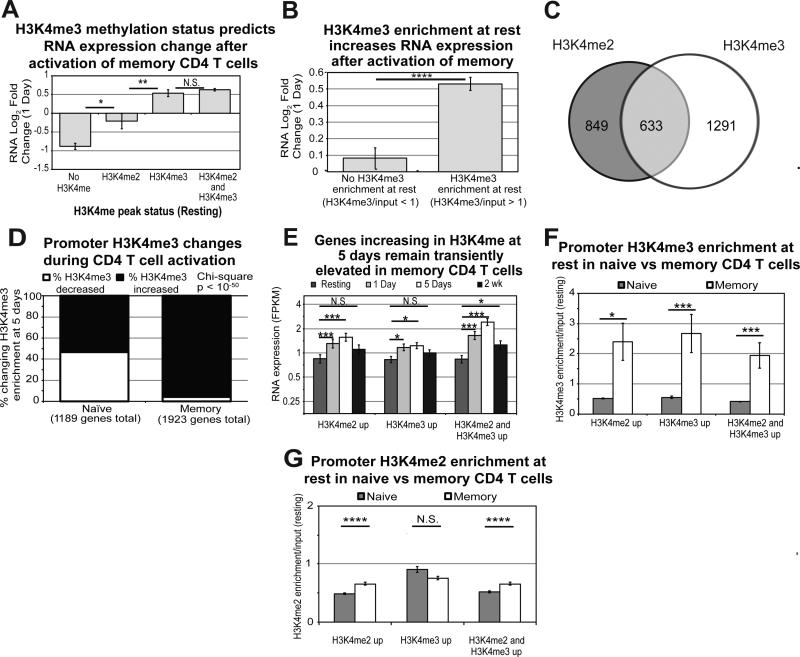
Figure 6. H3K4me3 enrichment plays a greater role in transcriptional upregulation in memory CD4 T cells during activation.
A) RNA Log2 Fold Changes at 1 day for genes containing no H3K4me, H3K4me2 alone, H3K4me3 alone, or both H3K4me2 and H3K4me3 at rest in memory cells. Error bars represent standard error of the mean. P-values are for two-tailed student t-test (*p<0.01, **p<001). B) RNA Log2 Fold Changes at 1 day for genes with H3K4me3 compared to no enrichment at rest in memory. Error bars represent standard error of the mean. P-values are for two-tailed student t-test (****p<1×10⁻⁵). C) Venn diagram for genes changing H3K4me2 and H3K4me3 enrichment 5 days after activation of memory CD4 T cells. D) Frequency plots for genes increasing or decreasing in H3K4me3 enrichment in naïve and memory CD4 T cells at 5 days. E) RNA expression for all time points examined was plotted for genes changing in H3K4me2 alone, H3K4me3 alone, and both at 5 days in memory cells. Error bars represent standard error of the mean. ***p<0.0001, *p<0.01 from Fisher's LSD post-hoc analysis following one-way ANOVA. F) Average enrichment for H3K4me3 across the promoter is plotted for the three classes of genes changing in H3K4 methylation during activation of naïve and memory CD4 T cells. Error bars represent standard error of the mean. P-value represents two-tailed student t-test (*p<0.01, ***p<0.0001). G) Average enrichment for H3K4me2 across the promoter is plotted for the three classes of genes changing in H3K4 methylation during activation of naïve and memory CD4 T cells. While differences in enrichment are statistically significant, the differences are modest and the biological significance is questionable. Error bars represent standard error of the mean. P-value represents two-tailed student t-test (****p<1×10⁻⁵).

