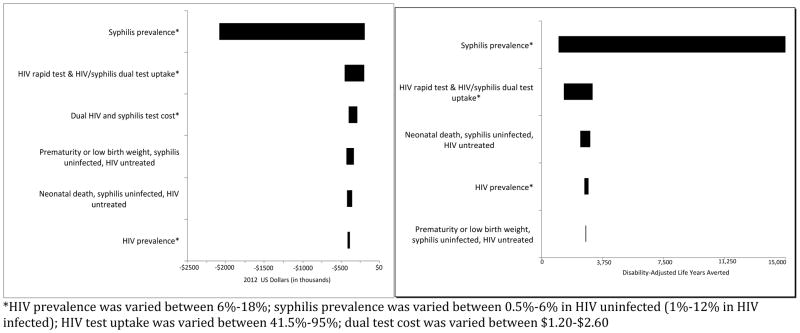
Figure 2.
Figure 2a. Tornado diagram of sensitivity analysis: incremental cost of HIV rapid test only versus dual HIV and syphilis test. This tornado diagram is a graphical representation of how the relative cost is impacted by varying model parameters from lower to upper ranges.
Figure 2b. Tornado diagram of sensitivity analysis: incremental effectiveness of HIV rapid test only versus dual HIV and syphilis test. This tornado diagram is a graphical representation of how the relative effectiveness is impacted by varying model parameters from lower to upper ranges.

