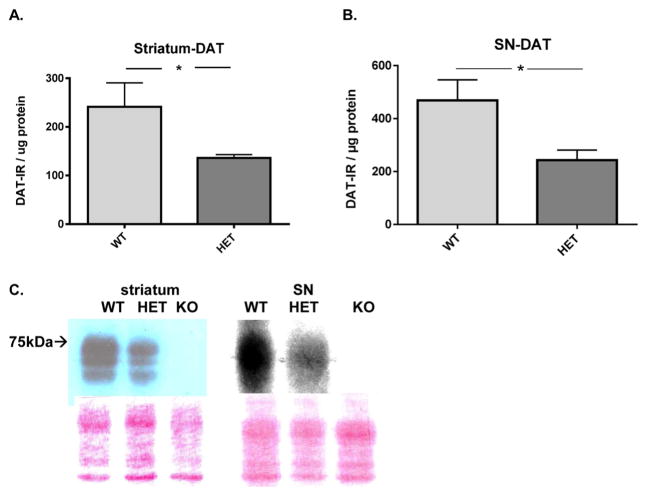
Figure 1.
DAT protein expression in nigrostriatal pathway. (A) Striatal DAT protein expression. DAT protein expression was on average 44% less in the DAT-HET versus WT (t = 1.97, *p = 0.035, df = 13). (B) Nigral DAT protein expression. DAT protein expression was on average 50% less in the DAT-HET versus WT (t = 2.62, *p < 0.05, df = 14). (C) Representative Western blot of DAT expression; wild-type (WT), heterozygotes (+/−, HET), and knockout (−/−, KO) in striatum (left) and SN (right). Nominal protein loads were 12 μg for striatum and 90 μg for the SN and reflect the difference in DAT expression between the two regions, being greater in the striatum. The Ponceau staining below the image reflects the protein loading among the genotypes from these particular sample preparations.

