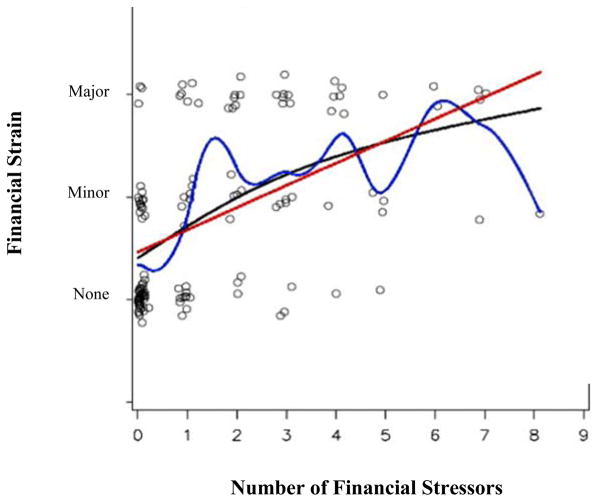
Figure 1.
The Relationship Between Financial Stress and Strain (N=158)
Note: Data points are kernelled to depict the number of cases by spreading each unique case around a single plot point. For example, in this figure the greatest number of cases is concentrated at zero indicators of stress and no strain. The regression line is the straight line summarizing predicted values assuming a linear relationship between financial stress and financial strain. The locally weighted line follows the largest concentration of cases across the regression line. The lowess curve illustrates predicted scores based on the assumption of a non-linear relationship.

