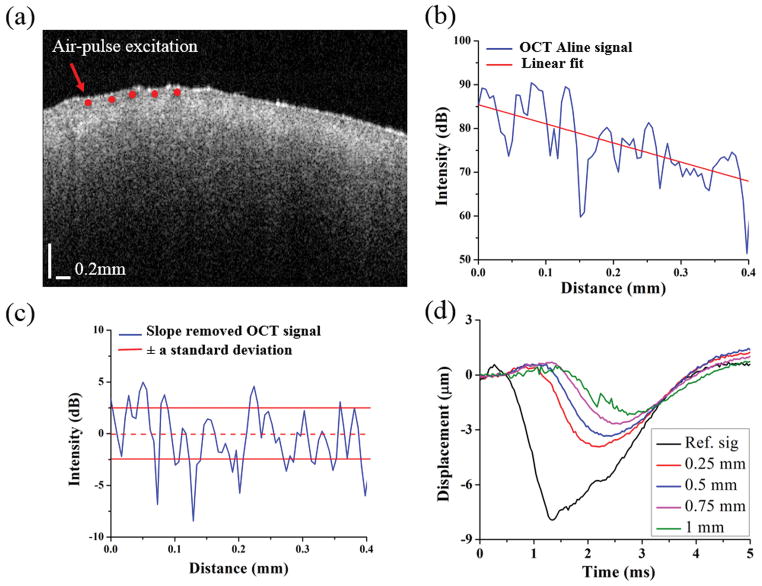
Figure 2.
OCT and OCE analysis procedures. (a) OCT structural image of a typical healthy murine kidney. (b) Single OCT image A-line signal selected from (a). (c) Slope-removed OCT A-line and standard deviation bounds used for SV calculation. (d) The temporal vertical displacement profiles corresponding to the red points in a single depth layer as plotted in (a), showing the elastic wave propagation.

