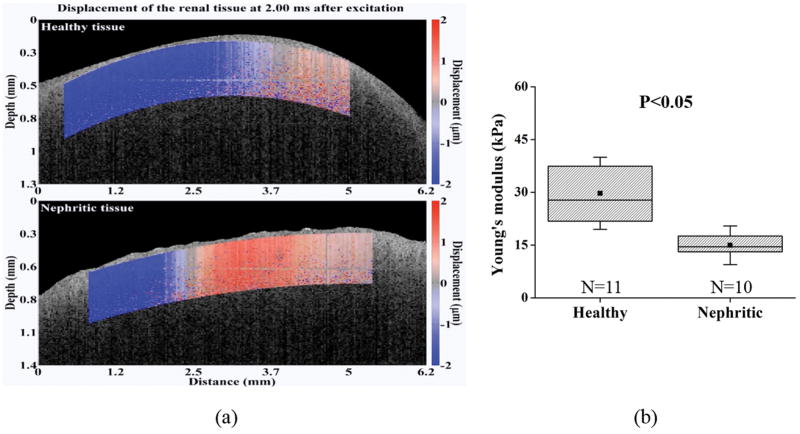
Figure 5.
OCE assessment and the computed Young’s modulus in the healthy (N=11) and nephritic kidneys (N=10). (a) Elastic wave propagation in the typical healthy (upper) and nephritic kidneys (lower) at 2 ms after excitation (Movie S1). (b) Shown plots are the quantified Young’s modulus based on elastic wave group velocity by Equation 3. The square dots and whiskers in (b) represent the mean and standard deviation values, respectively.

