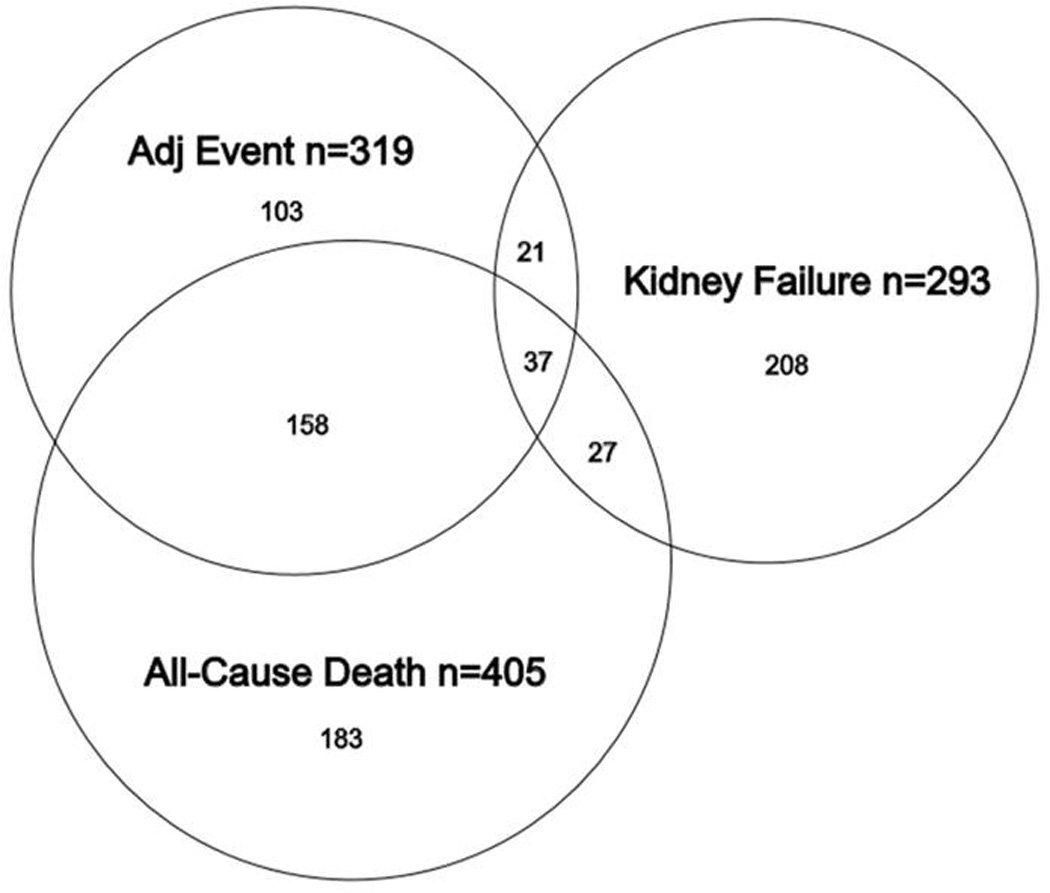
Figure 1. Distribution of clinical outcomes in the 3530 patients with complete data sets.

Venn diagram showing the distribution of adverse outcomes in 737 patients who experience at least one adverse outcome. Some patients experienced more than one clinical outcome.
