
Figure 2. Quartiles of BNP and cTnI and adverse outcomes.
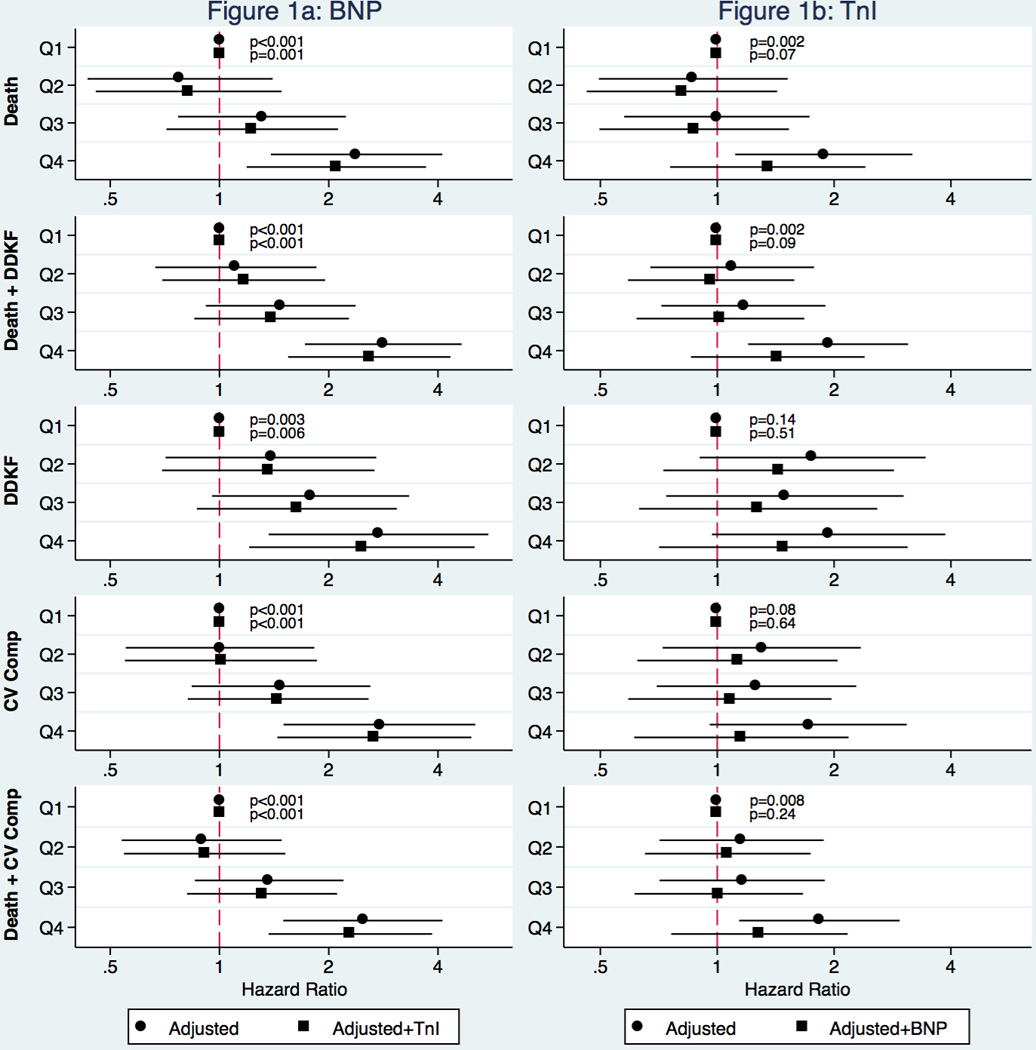
BNP and cTnI concentrations were stratified by quartiles and hazard ratios for individual adverse outcomes were calculated before (circles) and after (squares) adding the other biomarker to the model.