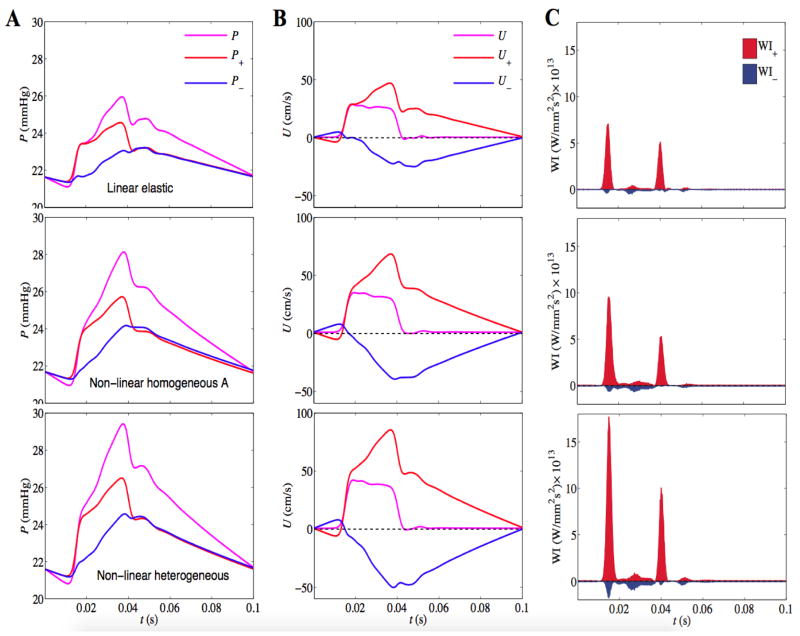
Figure 11. WIA in the main pulmonary artery for the linear elastic model (row 1), homogeneous A model (row 2) and heterogeneous model (row 3).
Separated pressure (A), velocity (B) and wave intensity (C) profiles are plotted for the incident and reflected wave components. Note the linear model shows considerably underestimated wave intensities evident from the shorter peaks of incident pressure and wave intensity profiles.

