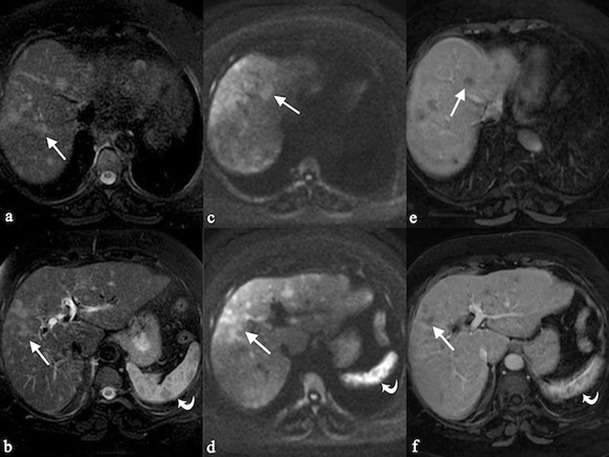
Fig. 2.

Hepatosplenic sarcoidosis. Liver MRI demonstrates multiple, scattered, small, hyperintense nodules (white arrows) on T2-weighted images (Fig. 2a and b) and on diffusion weighted imaging (DWI) (Fig. 2c and d); after gadolinium administration, nodules appear hypointense (Fig. 2e and f). In hepato-splenic sarcoidosis, T2 signal intensity reflects the degree of activity of disease: nodules can appear hyperintense in case of inflammation due to oedema and high vascular permeability; they have hypointense signal, when fibrosis is prevalent (see curved arrows for nodular lesions of the spleen)
