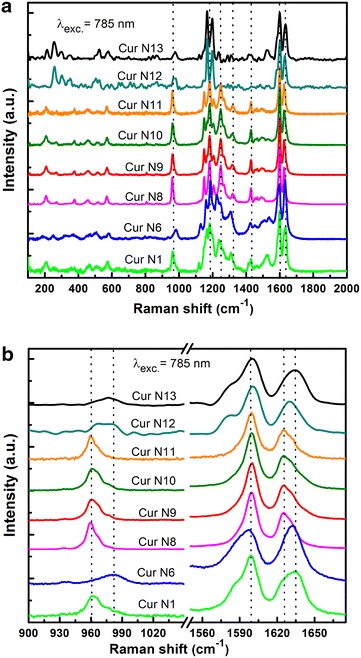
Fig. 3.

Raman spectra comparison of commercial curcumin samples being sold on the Vietnamese market and fabricated (Cur N1) sample (a), and a section of the spectra in the frequency range from 1550 to 1650 cm−1 is zoomed in for easy observation of differences at 959 and 1625 cm−1 for each different sample, plus samples N12, N13 (b)
