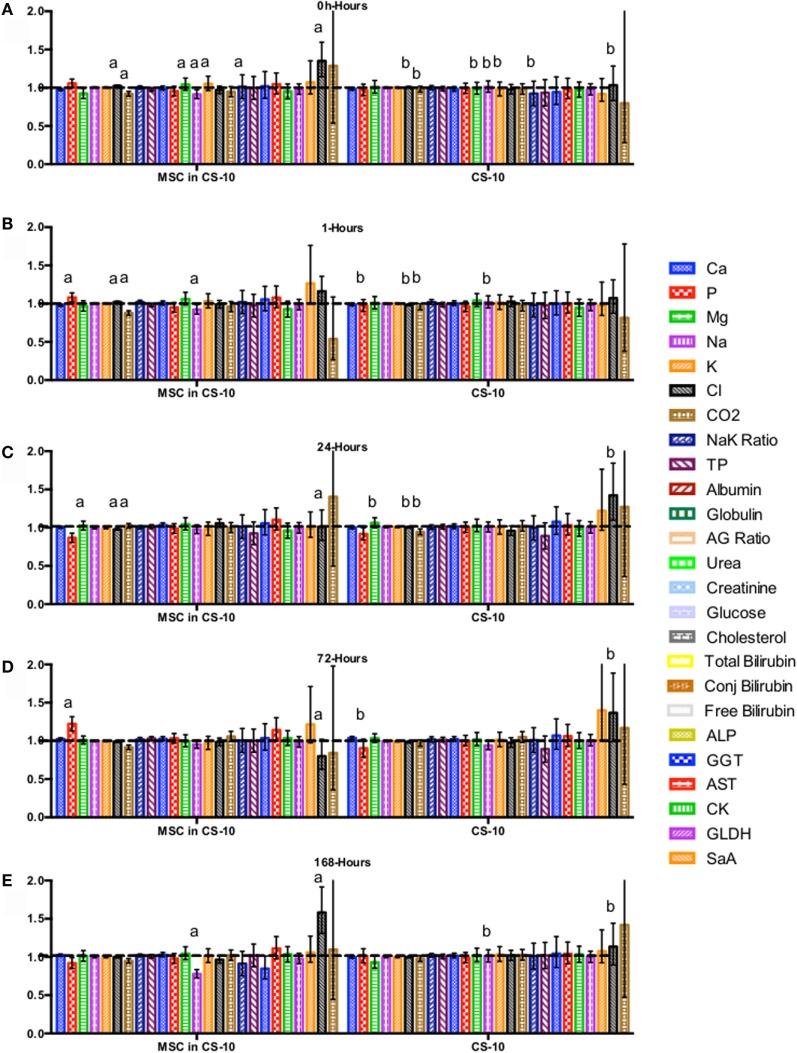
Figure 7.
Percent difference from pre-injection measurements (black dotted line) of biochemistry profile (A) 0 h, (B) 1 h, (C) 24 h (D) 72 h, (E) 168 h following intravenous injection of 5 × 10⁷ pooled allogeneic CB-MSC derived from 5 horses. CryoStor® CS10 (CS10) control. Error bars represent 95% confidence interval. Different letters indicate statistical differences between treatment and control groups for a specific parameter.

