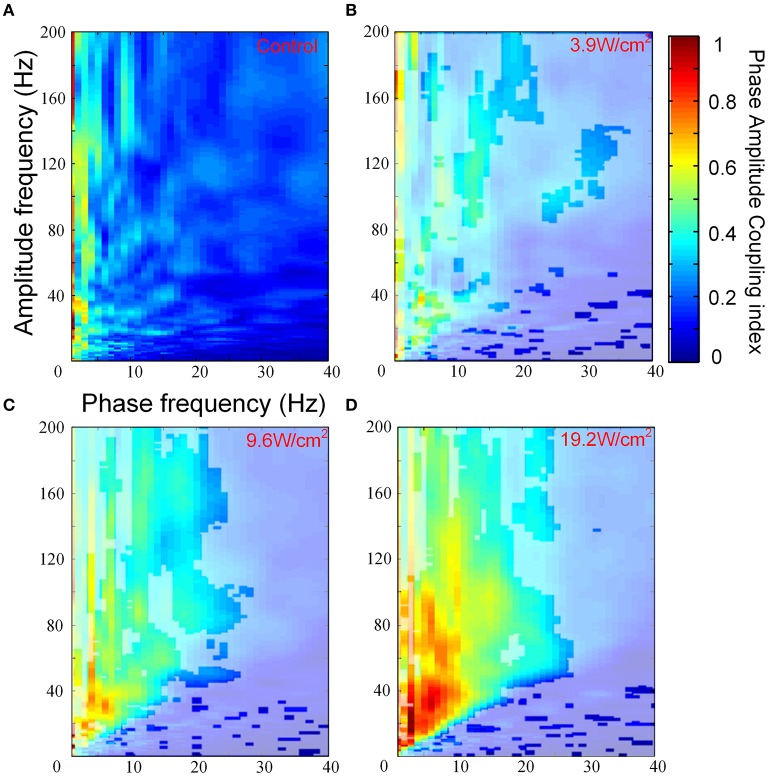
Figure 3.
(A) The images of the PACI as a function of the analytic phase (1–40 Hz) and the analytic amplitude (1–200 Hz) for the control (n = 6). (B–D) The images of the PACI as a function of the analytic phase (1–40 Hz) and the analytic amplitude (1–200 Hz) for the FUS with different ultrasonic intensities: (B) 3.9 W/cm2, (C) 9.6 W/cm2, (D) 19.2 W/cm2 (n = 6).

