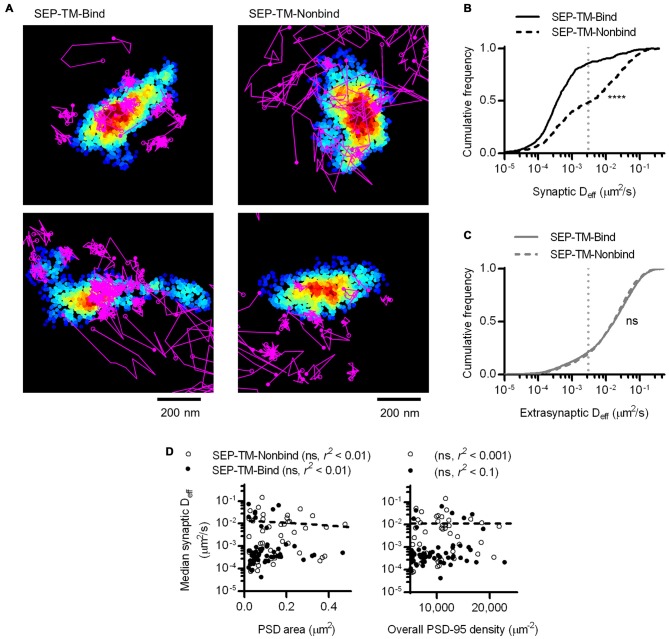
Figure 5.
A non-binding transmembrane protein enters and slows within the synapse, but not as much as if it can bind PSD-95. (A) Typical examples of tracked probes (purple) superimposed on shrPSD-95 positions (pseudo-colored on a scale of regional density same as Figure 4A; binding probe SEP-TM-Bind (left), nonbinding probe SEP-TM-Nonbind (right). (B) Cumulative frequency distributions of the binding probe and nonbinding probe Deff within PSDs (n = 654 tracks/113 PSDs/11 cells/3 cultures for SEP-TM-Bind, 519/91/10/3 SEP-TM-Nonbind). (C) Cumulative frequency distributions of the binding probe and nonbinding probe Deff outside of PSDs (n = 3349 tracks for SEP-TM-Bind, 4470 SEP-TM-Nonbind). (D) (Left) PSD area and median Deff within each of the PSDs; linear regression test (n = 91 PSDs/10 cells/3 cultures of SEP-TM-Nonbind, same as in Figure 3 for SEP-TM-Bind). (Right) Overall synaptic PSD-95 density and median Deff within each of the PSDs; linear regression test (n = as in left panel).

