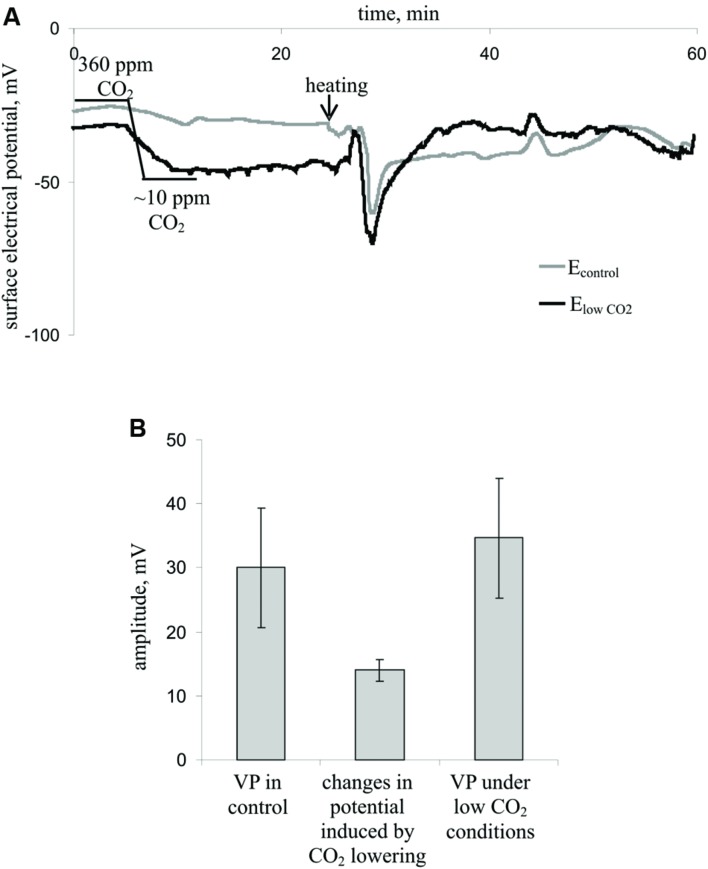
FIGURE 4.
Influence of decreasing the CO2 concentration on the surface membrane potential and VP in leaves (n = 7). (A) Changes in the surface electrical potential in leaflets at approximately 10 ppm CO2 concentration (ElowCO2) and in control leaflets (Econtrol). (B) Mean VP and CO2 decrease-induced changes in the surface potential. Significant differences between variants in Figure 4B were absent (Student’s t-test).

