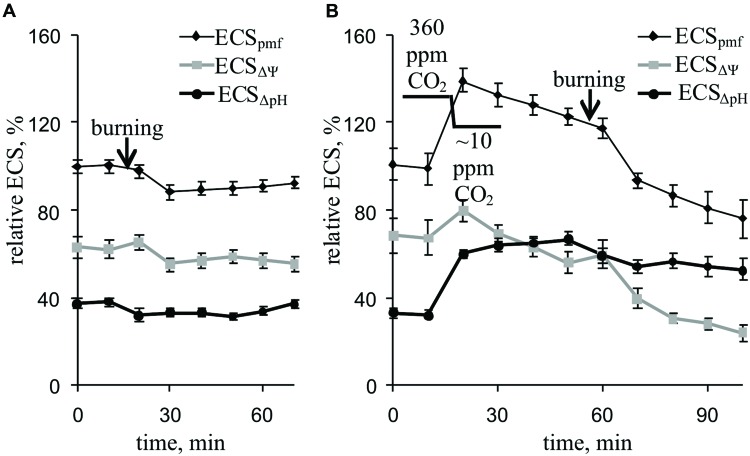
FIGURE 6.
Changes in the relative ECSpmf, ECSΔΨ, and ECSΔpH induced by VP at 360 ppm (A) and approximately 10 ppm (B) CO2 (n = 6–8). The mean ECSpmf magnitudes prior to VP or a decrease in the CO2 were assumed to be 100%. Points were measured every 600 s (450 s light, 150 s dark). The VP was induced by burning the first mature leaf (arrow).

