Figure 4.

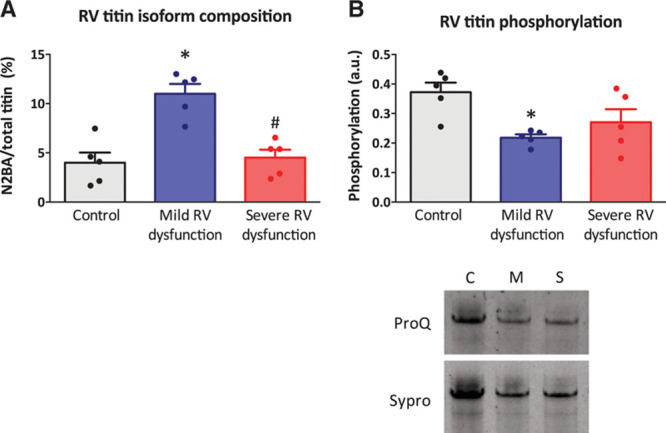
Right ventricular (RV) titin isoform composition and titin phosphorylation. A, Titin isoform ratio determined on 1% agarose gels stained with Coomassie Blue by dividing the N2BA isoform content to the more abundant N2B isoform and expressed in percentages. N2BA/total titin ratio was similar in control and severe RV dysfunction, whereas elevated in mild RV dysfunction. B, Total titin phosphorylation was determined by ProQ staining for phosphorylation divided by Sypro staining for total protein content. Titin phosphorylation was lower both in mild and severe RV dysfunction. C, Example of ProQ and Sypro staining of titin. Data are presented as mean±SEM. Controls: n=5, mild RV dysfunction: n=5, and severe RV dysfunction: n=5. *P<0.05. A.u. indicates arbitrary units.
