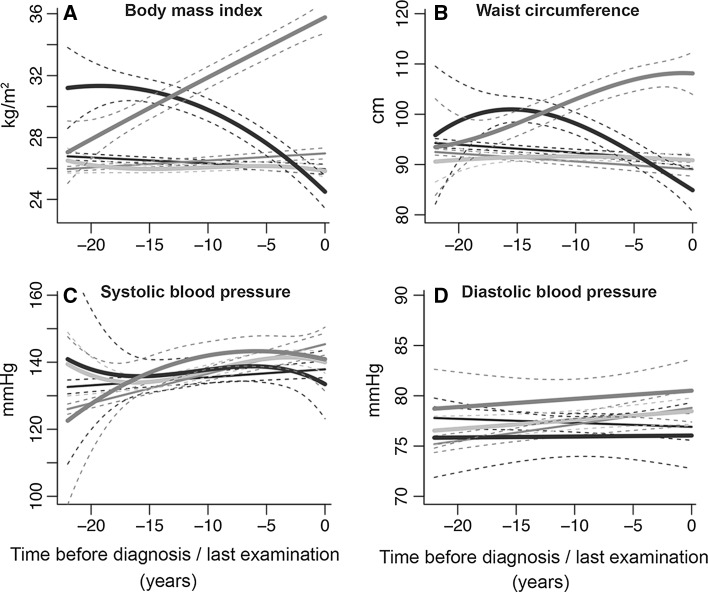
Fig. 2.
Trajectories of body mass index, waist circumference, systolic and diastolic blood pressure. Trajectories for risk factors during 22 years of follow-up until diagnosis of CVD, death or censoring from the study. The figures represent a hypothetical man of 65 years old. Trajectories for blood pressure represent a person on anti-hypertensive treatment. Light blue “stable weight” (including 87.8 % of CVD patients); dark blue “progressive weight loss” (including 5.8 % of CVD patients); red “progressive weight gain” (including 6.4 % of CVD patients); gray “CVD-free”; black “non-CVD mortality” groups. Similar trajectories for a hypothetical woman of 65 years of age are shown in Figure S1 in Supplementary Material. (Color figure online)

