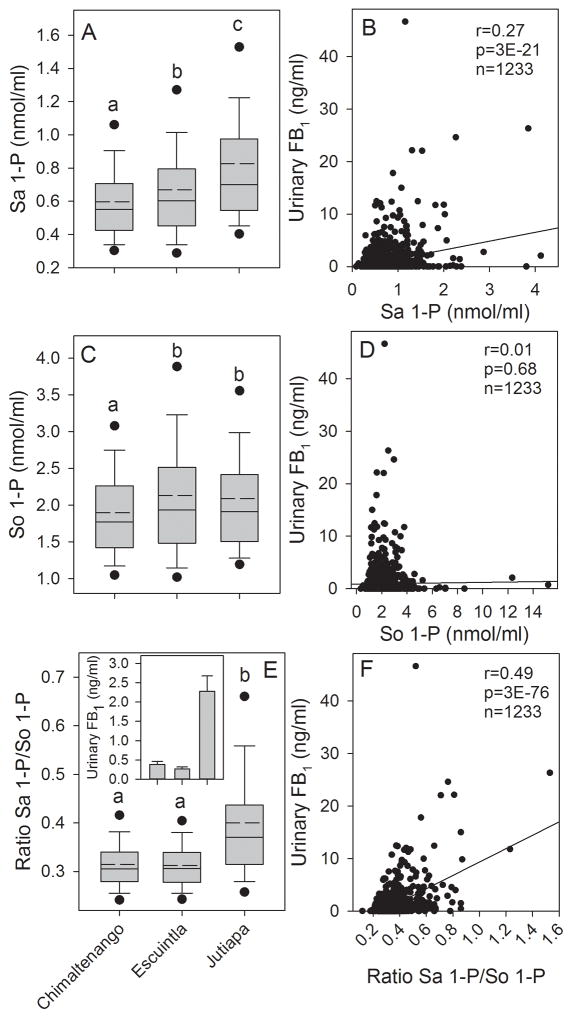
Figure 2.
(A) Box plot showing the mean (dashed line), median (solid line), 25th and 75th percentile (upper and lower limits of the box), the 10th and 90th percentile (error bars), and 5th and 95th percentile (solid circles) for the Sa 1-P concentration in the blood spot extracts from Chimaltenango, Escuintla, and Jutiapa for all subjects for all sampling periods combined (March, June and October 2011 and February 2012); (B) Scatter plot showing the correlation between the urinary FB1 levels and the Sa 1-P concentration in the matched blood spots for all subjects (Inset is the Pearson product moment correlation coefficient (r), p-value (p), and the total number of matched samples (n)); (C) Same as in (A) but for So 1-P; (D) same as in (B) but for So 1-P; (E) Same as in (A) but for the ratio of Sa 1-P/So 1-P and inset is the mean urinary FB1 and 95% CI from Torres et al. [15]; (F) same as in (B) but for the ratio Sa 1-P/So 1-P. In graphs A, C, and E, bars with differing superscripts are significantly different (p<0.05) based on the Kruskal-Wallis ANOVA on ranks.

