Figure 3.
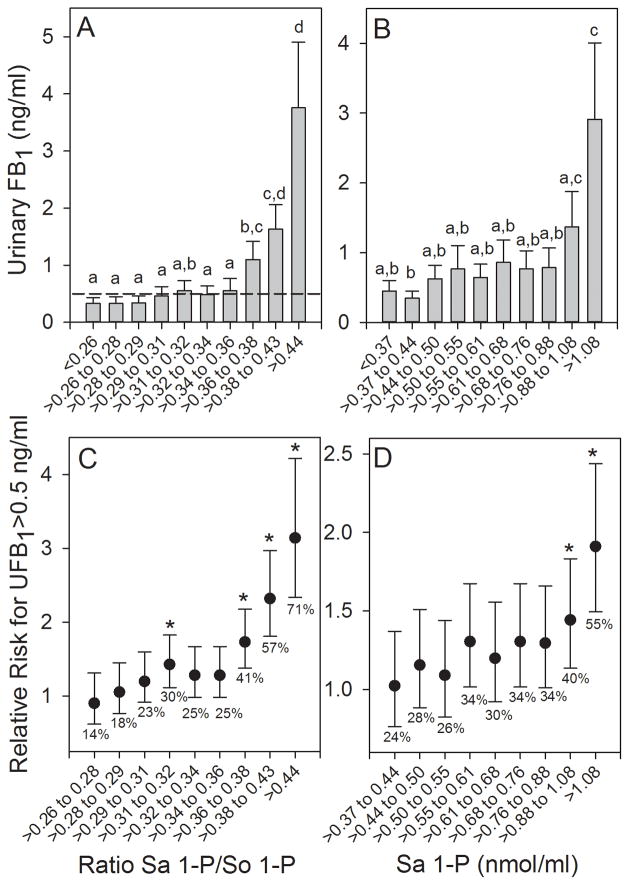
The relationship between urinary FB1 (UFB1) levels (mean and 95% CI) and the (A) Sa 1-P/So 1-P ratio and (B) concentration (nmol/ml) of Sa 1-P in blood spot extracts for 10 approximately equal groupings (n=123 or 124 individuals/group) of all subjects from Chimaltenango, Escuintla, and Jutiapa over all sampling periods combined (March, June and October 2011 and February 2012). The dashed reference line in (A) marks the UFB1 concentration equal to 0.5 ng/ml. Bars with differing superscripts are significantly different (p<0.05) based on the Kruskal-Wallis ANOVA on ranks. Panels (C) and (D) show the relationship between the increasing Sa 1-P/So 1-P ratio (C) and the concentration of Sa 1-P (D) and the increasing relative risk for exceeding a UFB1 concentration of 0.5 ng/ml. Mean UFB1 values with an asterisk (*) are significantly greater than the UFB1 in the Sa 1-P/So 1-P ratio or Sa 1-P grouping that was ≤ 0.26 or ≤0.37 nmol/ml, respectively. The percentages of individuals exceeding a UFB1 of 0.5 ng/ml are also shown.

