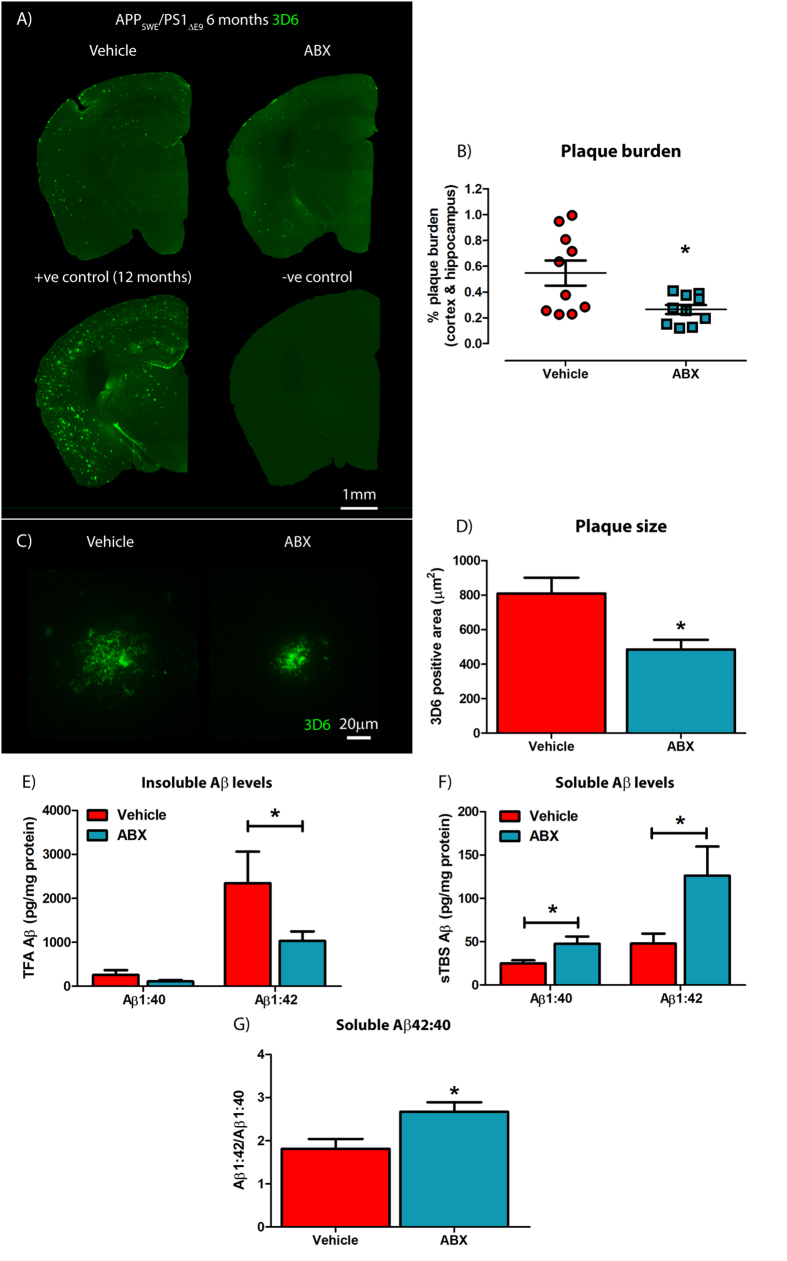
Figure 3. Amyloidosis is altered in ABX-treated male APPSWE/PS1ΔE9 mice.
(A) Representative immunohistochemical images of Aβ plaque deposition in vehicle control and ABX-treated male 6 month old APPSWE/PS1ΔE9 mice using anti-Aβ mAb 3D6. Each staining run was performed using sections from 12 month old APPSWE/PS1ΔE9 mice as a positive control and no primary antibody negative controls. (B) Plaque burden quantification in vehicle control and ABX-treated male 6 month old APPSWE/PS1ΔE9 mice using particle analysis of 3D6+ve immunofluorescence (n = 10, *p = 0.0169, unpaired two-tailed Student’s t-test). 3D6+ve area was averaged from 4 sections/mouse (240 μm apart) and expressed relative to total cortical and hippocampal area. (C) Representative x60 magnification z-stack maximum projection images of 3D6+ve Aβ plaques from vehicle control and ABX-treated male 6 month old APPSWE/PS1ΔE9 mice. (D) Quantification of plaque area using threshold-limiting immunofluorescence detection (n = 10, *p = 0.02, unpaired two-tailed Student’s t-test). (E) MSD Mesoscale® analysis of TFA-soluble (TBS-insoluble) Aβ1-40 and Aβ1-42 levels in combined cortical and hippocampal tissue of vehicle control and ABX-treated male 6 month old APPSWE/PS1ΔE9 mice using anti-Aβ mAb 4G8 (n = 10, *p = 0.0491, unpaired two-tailed Student’s t-test). (F) MSD Mesoscale® analysis of TBS-soluble Aβ1-40 and Aβ1-42 levels in combined cortical and hippocampal tissue of vehicle control and ABX-treated male 6 month old APPSWE/PS1ΔE9 mice using anti-Aβ mAb 4G8 (n = 10, *p < 0.05, unpaired two-tailed Student’s t-test). (G) Quantification of the Aβ1-40:Aβ1-42 ratio from the TBS-soluble MSD Mesoscale® data in vehicle control and ABX-treated male 6 month old APPSWE/PS1ΔE9 mice (n = 10, *p = 0.014, unpaired two-tailed Student’s t-test). Data are displayed as mean ± SEM. See Supplementary Figure 6–9 and statistical table 1 for additional information.

