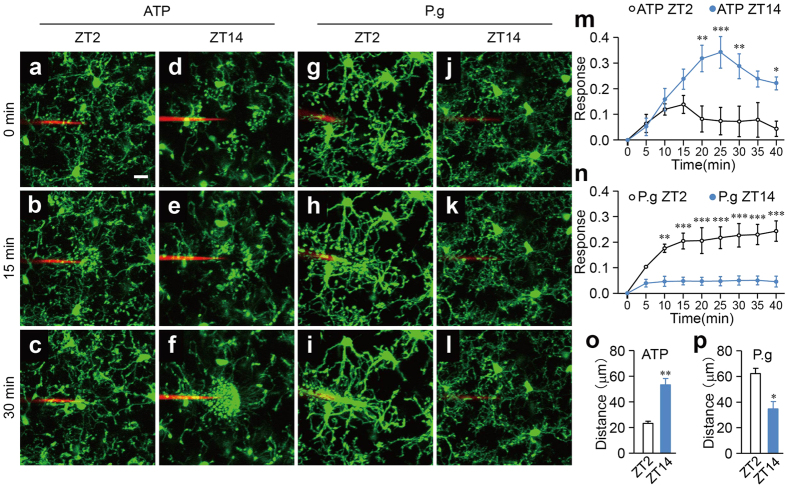
Figure 2. The differential diurnal variation in the dynamic behavior of the microglial processes in response to the focal injection of ATP and P. gingivalis.
(a–l) The dynamic response of the microglial processes to the local injection of 10 mM ATP (a–f) and 3.6 × 10⁵ CFU ml−1 P. gingivalis (g–l) in an open-skull preparation of CX3CR1GFP/+ mice at ZT2 and ZT14. Scale bar: 10 μm. (m,n) The kinetics of the mean fluorescent change in the microglial response to ATP (m) and P. gingivalis (n) at ZT2 and ZT14. The data are presented as the mean ± S.E.M. (N = 3 mice, n = 3–6 each). A two-way repeated measure ANOVA with Sidak’s test (ZT2 versus ZT14); from 10 to 40 min: p = 0.9985, p = 0.6209, p = 0.0030, p = 0.0006, p = 0.0082, p = 0.0939, p = 0.0455 (m), p = 0.0030, p = 0.0002, p = 0.0001; from 25 to 40 min: p = 0.0001 (n–p) The maximum distance from the reactive microglia to the injection of ATP (o) and P. gingivalis (P.g) (p) at ZT2 and ZT14. The data are presented as the mean ± S.E.M. A two-tailed unpaired t-test; **p = 0.0042 (o), *p = 0.0173 (p).

