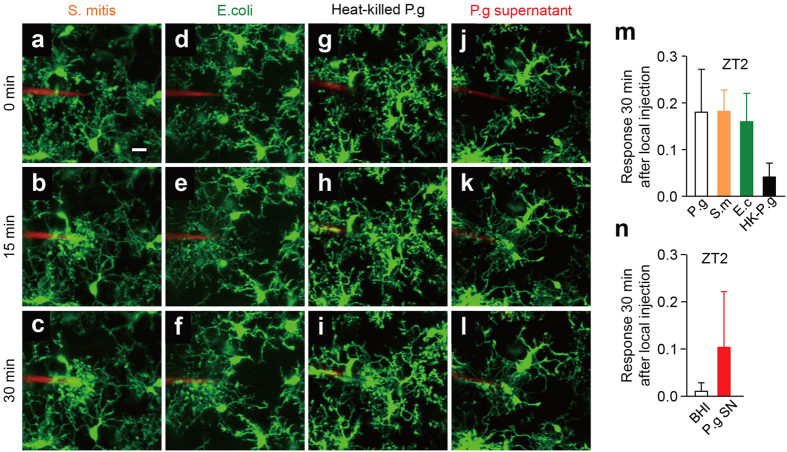
Figure 3. The effects of S. mitis, E. coli, heat-killed P. gingivalis and the supernatant prepared from P. gingivalis cultures on the microglial response.
(a–l) The dynamic response of the microglial processes to the local injection of various bacteria (3.6 × 10⁵ CFU ml−1) at ZT2. (a–c) S. mitis (S.m), (d–f) E. coli (E.c), (g–i) heat killed P.g (HK-P.g; 95 °C, 10 min), (j–l) P.g culture supernatant (P.g SN). Scale bar: 10 μm. (m) The kinetics of the mean fluorescent change in the microglial response measured at 30 min after the injection of various bacteria. The data are presented as the mean ± S.E.M. (N = 3 mice, n = 4–5 each). A one-way ANOVA with a post hoc Tukey’s test; P.g vs S.m: p > 0.9999, Pg. vs. E.c: p = 0.9953, P.g vs. HK-P.g: p = 0.4244, S.m vs. E.c: p = 0.9939, S.m vs. HK-P.g: p = 0.4126, E.c vs. HK-P.g: p = 0.5521. (n) The kinetics of the mean fluorescent change in the microglial response measured at 30 min after the injection of P. gingivalis. The data are presented as the mean ± S.E.M. (N = 3 mice, n = 5–6 each). A two-tailed unpaired t-test; P.g vs BHI (P.g culture medium, as a control): p = 0.0856.

