
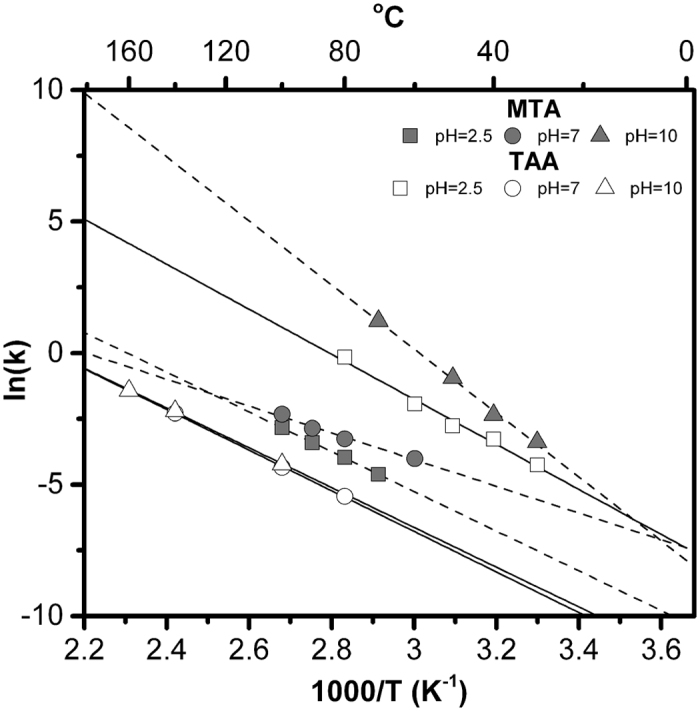
Figure 3. Arrhenius plots for the measured hydrolysis rates of TAA and MTA as a function of pH based on a pseudo-first order kinetic model.
Official websites use .gov
A
.gov website belongs to an official
government organization in the United States.
Secure .gov websites use HTTPS
A lock (
) or https:// means you've safely
connected to the .gov website. Share sensitive
information only on official, secure websites.