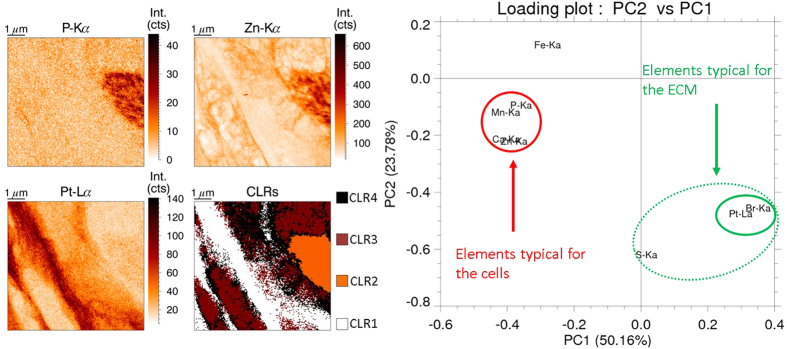
Figure 3. Data mining results from XRF maps. Scanned area 16 × 16 μm, beam dimensions 50 × 50 nm2, 50 nm step size, measurement time 0.1 s per point, primary beam energy 17.5 keV.
K-means clustering (left): combining the P, Zn and Pt elemental maps with the cluster map shows Pt (CLR1, white) resides outside the nucleus (CLR2, orange) and cytoplasm (CLR3, brown). PCA (right): strong link between Pt and Br and P, Mn, Ca and Zn.

