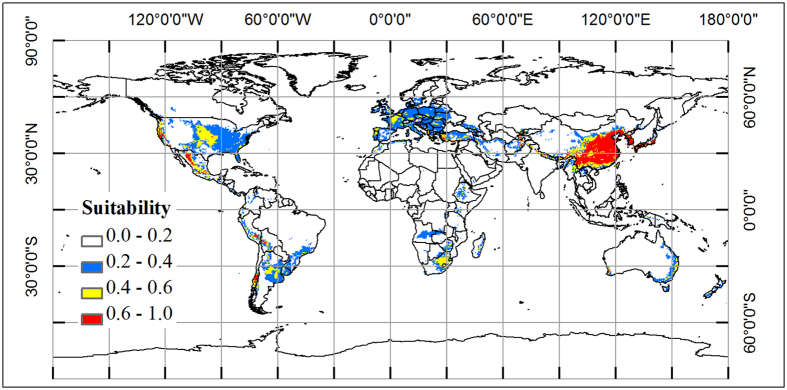
Figure 2. Spatial distribution map of potential area for oriental arborvitae around the world, which is produced by MaxEnt v3.3 (http://www.cs.princeton.edu/~schapire/maxent/), with a variation of each cell 0–0.11.
Blue color represents marginal habitat, orange color represents median habitat, and red color represents core habitat. The whole map is generated by using the tool of ArcGIS 9.3 (ESRI, Redlands, CA, USA, http://www.esri.com/).

