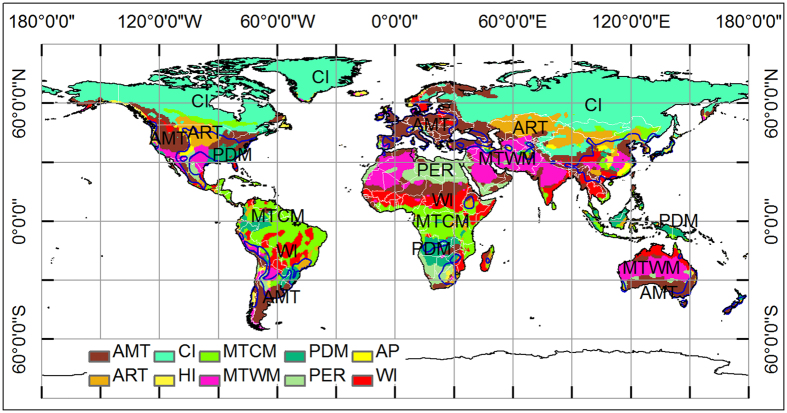
Figure 5. Spatial distribution of limiting factors for oriental arborvitae around the world, which is produced by MaxEnt v3.3 (http://www.cs.princeton.edu/~schapire/maxent/).
The limiting factors at any grid cell is generated from MESS analysis by finding the variable with the smallest MESS value. LFM analysis brings insight into which climatic factors mostly limit physiological and ecological processes in each grid cell in target areas. Coarse blue polygon represents potential distribution range of oriental arborvitae using threshold of 0.2. coldness index (CI), warmth index (WI), annual mean temperature (AMT), annual precipitation (AP), annual range of temperature (ART), precipitation of driest month (PDM), mean temperature of the warmest month (MTWM), mean temperature of the coldest month (MTCM), humidity index (HI), and potential evapotranspiration rate (PER). The whole map is generated by using the tool of ArcGIS 9.3 (ESRI, Redlands, CA, USA, http://www.esri.com/).

