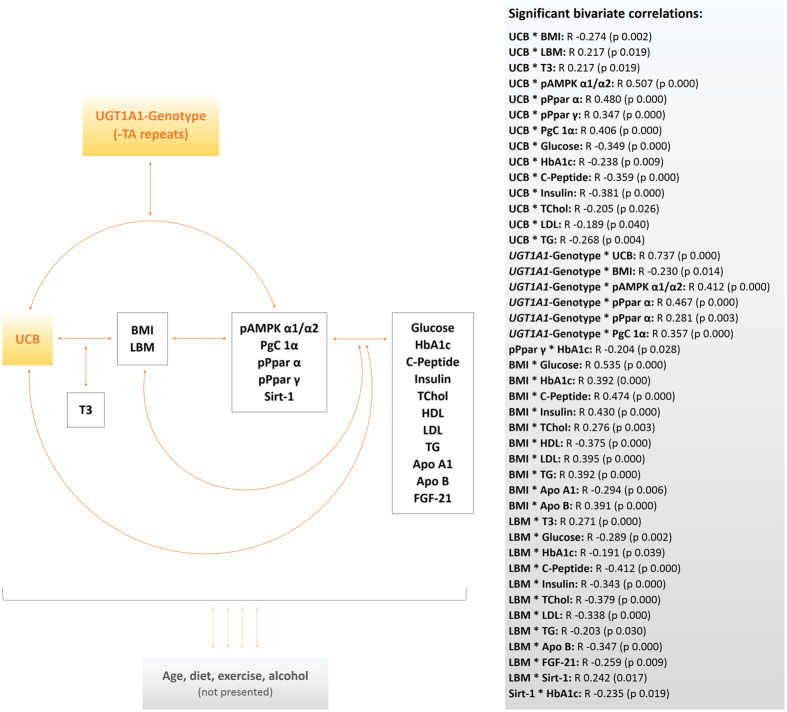
Figure 2. Graphical summary of inter-variable connections.
Figure 2 illustrates statistical connections of variables of interest. Bivariate correlations were calculated for the entire study population using the model of Spearman’s rho. R coefficients and p-values (p ≤ 0.05; in brackets) are presented in the grey box and summarised in a graphical model. For ease of reading, lifestyle factors have not been incorporated in detail, and are therefore only abstracted (bottom of figure). Abbreviations: UCB: unconjugated bilirubin; UGT1A1: UGT1A1 genotype; pAMPK α1/α2: Phosphorylated 5′-AMP activated kinase; pPpar α: Phosphorylated peroxisome proliferator activated receptor alpha; pPpar γ: Phosphorylated peroxisome proliferator activated receptor gamma; PgC 1α: Peroxisome proliferator-activated receptor c coactivator 1; Sirt-1: Sirtuin-1; FGF-21: Fibroblast growth factor 21; T3: Free triiodothyronine; BMI: Body mass index; LBM: Lean body mass; HbA1c: Glycated haemoglobin A1c; TChol: Total cholesterol; HDL: High density lipoprotein cholesterol; LDL: Low density lipoprotein cholesterol; TG: Triglyceride; LPA2: Lipoprotein A2; ApoA1: Apolipoprotein A1; ApoB: Apolipoprotein B.

