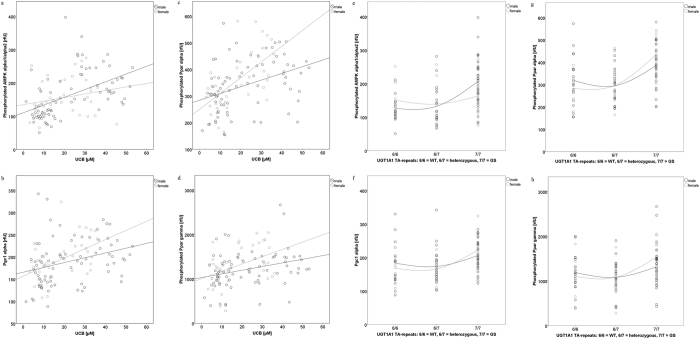
Figure 3.
Correlations of UCB (a–d) and the UGT1A1 genotype (e–h), with measures of the AMPK pathway. Figure 3 illustrates gender-specific correlations of UCB and the UGT1A1 genotype with measures of the AMPK pathway. Bivariate correlations between UCB/UGT1A1 genotype (-TA repeats: 6/6 controls, 6/7 heterozygous, 7/7 Gilbert’s syndrome) and measures of the AMPK pathway were calculated for each gender (m = male, f = female), using the model of Spearman’s rho. R coefficients and p-values (p ≤ 0.05; in brackets) are as follows: UCB * pAMPK α1/α2: m 0.594 (0.000); f 0.255 (0.122), UCB * PgC1 α: m 0.376 (0.001); f 0.467 (0.003), UCB * pPpar α: m 0.435 (0.000); f 0.575 (0.000), UCB * pPpar γ: m 0.354 (0.001); f 0.324 (0.047), UGT1A1 * pAMPK α1/α2: m 0.541 (p 0.000); f 0.156 (p 0.362), UGT1A1 * PgC1 α: m 0.265 (p 0.023); f 0.551 (p 0.001), UGT1A1 * Ppar α: m 0.365 (p 0.002); f 0.661 (p 0.000), UGT1A1 * Ppar γ: m 0.191 (p 0.023); f 0.435 (p 0.008). Abbreviations: UCB: unconjugated bilirubin; pAMPK α1/α2: Phosphorylated 5′-AMP activated kinase; pPpar α: Phosphorylated peroxisome proliferator activated receptor alpha; pPpar γ: Phosphorylated peroxisome proliferator activated receptor gamma; PgC 1α: Peroxisome proliferator-activated receptor c coactivator 1; WT: wild type (control subjects); GS: Gilbert’s syndrome.

