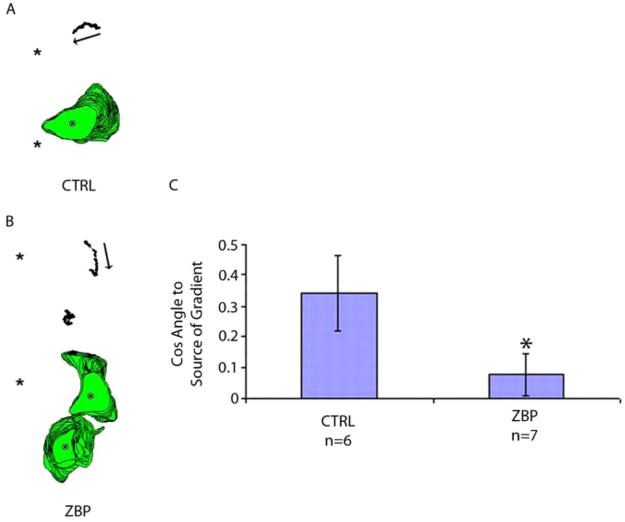
Fig. 2.
ZBP1 expression reduces movement in the direction of a chemoattractive gradient. (A,B) Perimeter and centroid plots are from (A) GFP-expressing or (B) GFP-ZBP1-expressing MTLn3 cells when exposed to a gradient of EGF after starvation. These results are representative of cell behaviors over the time frame analyzed (1 hour at 1-minute intervals; * indicates needle position, which is the source of EGF). (C) Quantification of cell movement relative to an EGF gradient. The angle between cell movement and the direction of applied chemoattractant indicates how well a cell orients to the chemoattractant, with a smaller angle suggesting greater alignment of the directions. This is reflected in our results, which take the cosine of the angle, and for which a greater alignment would give a value closer to 1 and lower degree of alignment gives a lower value, and 0 would indicate average random motion. MTLn3 cells are efficiently stimulated to move along the gradient, whereas ZBP1-expressing cells less efficiently orient and move in response to such a gradient (*P=0.035, error bars indicate ± s.e.m.).

